10-K: Annual report [Section 13 and 15(d), not S-K Item 405]
Published on
Table of Contents
SECURITIES AND EXCHANGE COMMISSION
Washington, D.C. 20549
FORM 10-K
(Mark One)
| þ | ANNUAL REPORT PURSUANT TO SECTION 13 OR 15(d) OF THE SECURITIES EXCHANGE ACT OF 1934 |
For the fiscal year ended December 31, 2005
OR
| o | TRANSITION REPORT PURSUANT TO SECTION 13 OR 15(d) OF THE SECURITIES EXCHANGE ACT OF 1934 |
For
the transition period from ___ to ___
Commission file number: 001-13122
RELIANCE STEEL & ALUMINUM CO.
(Exact name of registrant as specified in its charter)
| California | 95-1142616 | |
| (State or other jurisdiction of incorporation or organization) |
(I.R.S. Employer Identification No.) |
350 South Grand Avenue, Suite 5100
Los Angeles, California 90071
(213) 687-7700
(Address of principal executive offices and telephone number)
Los Angeles, California 90071
(213) 687-7700
(Address of principal executive offices and telephone number)
Securities registered pursuant to Section 12(b) of the Act:
| Name of each exchange on | ||
| Title of each class | which registered | |
| Common Stock | New York Stock Exchange |
Securities registered pursuant to Section 12(g) of the Act:
None
None
Indicate by check mark if the registrant is a well-known seasoned issuer, as defined in Rule
405 of the Securities Act.
Yes þ No o
Yes þ No o
Indicate by check mark if the registrant is not required to file reports pursuant to Section
13 or Section 15(d) of the Act.
Yes o No þ
Yes o No þ
Indicate by check mark whether the registrant (1) has filed all reports required to be filed
by Section 13 or 15(d) of the Securities Exchange Act of 1934 during the preceding 12 months (or
for such shorter period that the registrant was required to file such reports), and (2) has been
subject to such filing requirements for the past 90 days.
Yes þ No o
Yes þ No o
Indicate by check mark if disclosure of delinquent filers pursuant to Item 405 of Regulation
S-K is not contained herein and will not be contained, to the best of the registrant’s knowledge,
in definitive proxy or information statements incorporated by reference in Part III of this Form
10-K or any amendment to this Form 10-K. þ
Indicate by check mark whether the registrant is a large accelerated filer, an accelerated
filer, or a non-accelerated filer. See definition of “accelerated filer and large accelerated
filer” in Rule 12b-2 of the Exchange Act. (Check one):
Large accelerated filer þ Accelerated filer o Non-accelerated filer o
Indicate by check mark whether the registrant is a shell company (as defined in Rule 12b-2 of the Act). Yes o No þ
The aggregate market value of the voting stock held by non-affiliates of the registrant, based
on the closing price on the New York Stock Exchange on June 30, 2005 was $1,177,105,989.
As of February 28, 2006, 33,156,699 shares of the registrant’s common stock, no par value,
were outstanding.
DOCUMENTS INCORPORATED BY REFERENCE
None.
Table of Contents
INDEX
| Page | ||||||||
| 1 | ||||||||
| 1 | ||||||||
| 2 | ||||||||
| 5 | ||||||||
| 6 | ||||||||
| 6 | ||||||||
| 6 | ||||||||
| 8 | ||||||||
| 8 | ||||||||
| 8 | ||||||||
| 9 | ||||||||
| 9 | ||||||||
| 10 | ||||||||
| 10 | ||||||||
| 10 | ||||||||
| 11 | ||||||||
| 11 | ||||||||
| 11 | ||||||||
| 16 | ||||||||
| 16 | ||||||||
| 19 | ||||||||
| 19 | ||||||||
| 20 | ||||||||
| 22 | ||||||||
| 24 | ||||||||
| 33 | ||||||||
| 34 | ||||||||
| 61 | ||||||||
| 61 | ||||||||
| 61 | ||||||||
| 63 | ||||||||
| 66 | ||||||||
| 71 | ||||||||
| 73 | ||||||||
| 74 | ||||||||
| 75 | ||||||||
| 77 | ||||||||
| Exhibit 14.01 | ||||||||
| Exhibit 21 | ||||||||
| Exhibit 23 | ||||||||
| Exhibit 31.1 | ||||||||
| Exhibit 31.2 | ||||||||
| Exhibit 32 | ||||||||
i
Table of Contents
SAFE HARBOR STATEMENT UNDER THE PRIVATE
SECURITIES LITIGATION REFORM ACT OF 1995
SECURITIES LITIGATION REFORM ACT OF 1995
This Annual Report on Form 10-K contains forward-looking statements. You should read
carefully any statements containing the words “expect,” “believe,” “anticipate,” “project,”
“estimate,” “predict,” “intend,” “should,” “could,” “may,” “might,” or similar expressions or the
negative of any of these terms.
Forward-looking statements involve known and unknown risks and uncertainties. Various
factors, such as the “Risk Factors” listed below and further discussed in detail in Item 1A of this
filing may cause our actual results, performance, or achievements to be materially different from
those expressed or implied by any forward-looking statements. Among the factors that could cause
our results to differ are the following:
| • | Our interest rates on our debt could change. The interest rates on our variable rate debt increased steadily during 2005, and we anticipate that these rates will continue to increase through 2006. | ||
| • | Foreign currency exchange rates could change, which could affect the price we pay for certain metals and the results of our foreign operations. | ||
| • | Our acquisitions might fail to perform as we anticipate. This could result in an impairment charge to write off some or all of the goodwill for that entity. | ||
| • | Our future operating results depend on a number of factors beyond our control, such as the prices for and the availability of metals, which could cause our results to fluctuate significantly over time. During periods of low customer demand it could be more difficult for us to pass through price increases to our customers, which could reduce our gross profit and net income. | ||
| • | We service industries that are highly cyclical, and downturns in our customers’ industries could reduce our revenue and profitability. | ||
| • | Changes in demand for the products we sell can cause significant fluctuations in both availability and cost of the products. A significant or rapid increase or decrease in costs from current levels could have a severe negative impact on our gross profit. | ||
| • | The success of our business is affected by general economic conditions and, accordingly, our business was adversely impacted by the economic slowdown or recession in 2003, 2002 and 2001. This could occur in future periods. | ||
| • | Our business is very competitive and increased competition could reduce our gross profit margins and net income. | ||
| • | As a decentralized business, we depend on both senior management and our operating employees; if we are unable to attract and retain these individuals, our results of operations may decline. | ||
| • | We may not be able to consummate future acquisitions, and those acquisitions that we do complete may be difficult to integrate into our business. | ||
| • | We are subject to various environmental and other governmental regulations which may require us to expend significant capital and incur substantial costs. | ||
| • | If existing shareholders sell their shares, the market price of our common stock could be depressed. | ||
| • | Principal shareholders who own a significant number of our shares may have interests that conflict with yours. | ||
| • | We have implemented a staggered or classified Board that may adversely impact your rights as a shareholder. | ||
| • | We may discover internal control deficiencies in our decentralized operations or in an acquisition that must be reported in our SEC filings, which may result in a negative reaction that adversely impacts our stock price. |
Although we believe the expectations reflected in the forward-looking statements are
reasonable, we cannot guarantee future performance or results. We are not obligated to update or
revise any forward-looking statements, whether as a result of new information, future events or
otherwise. You should consider these risks when reading any forward-looking statements.
This Annual Report on Form 10-K includes trademarks, trade names and service marks of the Company
and its subsidiaries.
ii
Table of Contents
PART I
Item 1. Business
We are one of the largest metals service center companies in the United States. Our network
of 24 divisions, 21 operating subsidiaries and a 70%-owned company operates more than 100 locations
in 32 states, Belgium, China and South Korea. Through this network, we provide metals processing
services and distribute a full line of more than 90,000 metal products, including alloy, aluminum,
brass, copper, carbon steel, titanium, stainless steel and specialty steel products, to more than
95,000 customers in a broad range of industries. Many of our metals service centers process and
distribute only specialty metals. We deliver products from facilities in Alabama, Arizona,
California, Colorado, Florida, Georgia, Idaho, Illinois, Indiana, Iowa, Kansas, Kentucky,
Louisiana, Maryland, Michigan, Minnesota, Missouri, Montana, Nevada, New Hampshire, New Jersey, New
Mexico, North Carolina, Ohio, Oregon, Pennsylvania, South Carolina, Tennessee, Texas, Utah,
Washington and Wisconsin. One of our subsidiaries has an international location in South Korea
that serves the Asian semiconductor markets. Another subsidiary opened a metals service center in
Belgium in January 2003 to service the European aerospace market. On March 1, 2006, our 70%-owned
joint venture company, based in Singapore, acquired a metals service center company in China that
mainly serves the electronics industry in China.
Our primary business strategy is to enhance our operating results through strategic
acquisitions, expansion of our existing operations and improved operating performance at our
locations. This strategy and our proven operating methods have enabled us to outperform most of
our competitors in the metals service center industry. We believe
that our geographic, customer and
product diversification also makes us less vulnerable to regional or industry specific economic
volatility. Following the economic recession in 2001, 2002 and 2003, our industry experienced a
broad-based significant and unprecedented upturn in 2004 that continued for many of our products
throughout 2005. In 2005, we had record net sales of $3.4 billion and record net income of $205.4
million.
Industry Overview
Metals service centers acquire products from primary metals producers and then process carbon
steel, aluminum, stainless steel and other metals to meet customer specifications, using techniques
such as blanking, leveling (or cutting-to-length), sawing, shape cutting, shearing and slitting.
These processing services save our customers time, labor, and expense and reduce their overall
manufacturing costs. Specialized equipment used to process the metals requires high-volume
production to be cost effective. Many manufacturers are not able or willing to invest in the
necessary technology, equipment, and inventory to process the metals for their own manufacturing
operations. Accordingly, industry dynamics have created a niche in the market. Metals service
centers purchase, process, and deliver metals to end-users in a more efficient and cost-effective
manner than the end-user could achieve by dealing directly with the primary producer or with an
intermediate steel processor. Industry analysts estimate that, historically in the United States,
based on tonnage, metals service centers and processors annually purchase and distribute
approximately:
| • | 30% of all carbon industrial steel products produced in the United States; | ||
| • | 45% of all stainless steel produced in the United States; and | ||
| • | 36% of all aluminum sold in the mill/distributor shared markets (which excludes that sold for aluminum cans, among other things). |
These percentages have not changed significantly in the last five years. In the May 2005
issue, the magazine Purchasing reported that the North American metals distribution industry was
estimated to have generated revenues of about $85 billion in 2004 (the latest year for which such
information is available), up from $72 billion in 2000 and $58 billion in 2003, and that shipments
of steel, aluminum, copper metals and superalloys to domestic buyers in 2004 were a record 63.5
million tons.
The metals service center industry is highly fragmented and intensely competitive within
localized areas or regions. Many of our competitors operate single stand-alone service centers.
According to industry sources, the number of intermediate steel processors and metal center
facilities in North America has decreased from approximately 7,000 locations in 1980 to
approximately 3,500 locations operated by more than 1,300 companies in 2003 (Purchasing, May 2003).
This consolidation trend creates opportunities for us to make acquisitions.
Metals service centers are generally less susceptible to market cycles than producers of the
metals, because service centers are usually able to pass on all or a portion of increases in metal
costs to their customers. In 2002 and 2003, it was more difficult for our industry to pass through
price increases of certain carbon steel products, as the increased costs resulted from supply
constraints rather than customer demand, which is more typical. In 2004, these dynamics changed
significantly as domestic mill shutdowns and increased global demand limited availability of
several carbon steel products. This limited supply, along with somewhat improved U.S. demand,
allowed service centers to increase their selling prices and pass these costs on to their
customers. In 2005, although supply was not as limited as in 2004 and carbon steel prices declined
from 2004 levels, the consolidation at the carbon steel mill level resulted in a more stable pricing environment for
carbon steel products.
1
Table of Contents
Demand and pricing for carbon steel products improved near the end of 2005.
Aluminum and stainless steel pricing rose throughout 2005, with significant and rapid price and
demand increases for aerospace-related products during 2005. We believe that service centers with
the most rapid inventory turnover are generally the least vulnerable to changing metals prices.
Customers purchase from service centers to obtain value-added metals processing, readily
available inventory, reliable and timely delivery, flexible minimum order size, and quality
control. Many customers deal exclusively with service centers because the quantities of metal
products that they purchase are smaller than the minimum orders specified by mills or because those
customers require intermittent deliveries over long or irregular periods. Metals service centers
respond to a niche market created because of the focus of the capital goods and related industries
on just-in-time inventory management and materials management outsourcing, and because integrated
mills have reduced in-house direct sales efforts to small sporadic purchasers to enhance their
production efficiency.
History of Reliance
Reliance Steel & Aluminum Co. was organized as a California corporation on February 3, 1939,
and commenced business in Los Angeles, California fabricating steel reinforcing bar. Within ten
years, we had become a full-line distributor of steel and aluminum, operating a single metals
service center in Los Angeles. In the early 1950’s, we automated our materials handling operations
and began to provide processing services to meet our customers’ requirements. In the 1960’s, we
began to acquire other companies to establish additional service centers, expanding into other
geographic areas.
In the mid-1970’s, we began to establish specialty metals centers stocked with inventories of
selected metals such as aluminum, stainless steel, brass, and copper, and equipped with automated
materials handling and precision cutting equipment. We have continued to expand our network, with
a focus on servicing our customers as opposed to merely distributing metal. In 2003, we acquired a
company that processes metal for a fee without taking ownership of the metal. We have not
diversified outside of our core business and we strive to consistently perform as one of the best
in our industry. We operate metals service centers under the following trade names:
| No. of | ||||
| Trade Name | Locations | Primary Products Processed & Distributed | ||
Reliance Divisions |
||||
Affiliated Metals |
1 | Plate and Flat-Rolled Aluminum and Stainless Steel | ||
Bralco Metals |
5 | Aluminum, Brass, Copper and Stainless Steel | ||
Engbar Pipe & Steel Co. |
1 | Carbon Steel Bars, Pipe and Tubing | ||
MetalCenter |
1 | Flat-Rolled Aluminum and Stainless Steel | ||
Olympic Metals |
1 | Aluminum, Brass, Copper and Stainless Steel | ||
Reliance Metalcenter |
10 | Variety of Carbon Steel and Non-Ferrous Metal Products | ||
Reliance Steel Company |
2 | Carbon Steel | ||
Tube Service Co. |
6 | Specialty Tubing | ||
Allegheny Steel Distributors, Inc. |
1 | Carbon Steel | ||
Aluminum and Stainless, Inc. |
2 | Aluminum Sheet, Plate and Bar | ||
American Metals Corporation. |
3 | Carbon Steel | ||
American Steel, L.L.C.. |
2 | Carbon Steel | ||
AMI Metals, Inc. |
||||
AMI Metals |
6 | Heat-Treated Aluminum Sheet and Plate | ||
AMI Metals Europe S.P.R.L. |
1 | Heat-Treated Aluminum Sheet and Plate | ||
CCC Steel, Inc. |
||||
CCC Steel |
1 | Structural Steel | ||
IMS Steel |
1 | Structural Steel | ||
Central Plains Steel Co. |
2 | Carbon Steel | ||
Chapel Steel Corp. |
5 | Carbon Steel Plate | ||
Chatham Steel Corporation |
5 | Full-Line Service Centers | ||
Durrett Sheppard Steel Co., Inc. |
1 | Carbon Steel Plate, Bar and Structurals | ||
Everest Metals (Suzhou) Co., Ltd. |
1 | Aluminum Plate and Bar | ||
Liebovich Bros., Inc. |
||||
Liebovich Steel & Aluminum Company |
2 | Full-Line Service Centers | ||
Good Metals Company |
1 | Tool and Alloy Steels | ||
Hagerty Steel & Aluminum Company |
1 | Plate and Flat-Rolled Carbon Steel |
2
Table of Contents
| No. of | ||||
| Trade Name | Locations | Primary Products Processed & Distributed | ||
Liebovich
Custom Fabricating Company |
1 | Metal Fabrication | ||
Liebovich/PDM Steel & Aluminum Company |
1 | Carbon Steel Structurals and Plate | ||
Lusk Metals |
1 | Precision Cut Aluminum Plate and Aluminum Sheet and Extrusions |
||
Pacific Metal Company |
7 | Aluminum and Coated Carbon Steel | ||
PDM Steel Service Centers, Inc. |
7 | Carbon Steel Structurals and Plate | ||
Phoenix Corporation |
||||
Phoenix Metals Company |
7 | Flat-Rolled Aluminum, Stainless Steel and Coated Carbon Steel | ||
Steel Bar |
1 | Carbon Steel Bars and Tubing | ||
Precision Strip, Inc. |
8 | Toll Processing (Slitting,
Leveling, Blanking) of Aluminum, Stainless Steel and Carbon
Steel |
||
Service Steel Aerospace Corp. |
||||
Service Steel Aerospace |
2 | Stainless and Alloy Specialty Steels | ||
United Alloys Aircraft Metals |
1 | Titanium Products | ||
Siskin Steel & Supply Company, Inc. |
||||
Siskin Steel |
4 | Full-Line Service Centers | ||
East Tennessee Steel Supply |
1 | Carbon Steel Plate, Bar and Structurals | ||
Georgia Steel Supply Company |
1 | Full-Line Service Center | ||
Toma Metals, Inc. |
1 | Stainless Steel Sheet and Coil | ||
Valex Corp. |
||||
Valex |
4 | Electropolished Stainless Steel Tubing and Fittings | ||
Valex Korea Co., Ltd. |
1 | Electropolished Stainless Steel Tubing and Fittings | ||
Viking Materials, Inc. |
2 | Flat-Rolled Carbon Steel |
We serve our customers primarily by providing quick delivery, metals processing and inventory
management services. We purchase a variety of metals from primary producers and sell these
products in small quantities based on our customers’ needs. For about 45% of our sales orders, we
perform metals processing services, or first-stage processing, before distributing the product to
manufacturers and other end-users, often within 24 hours from receipt of an order, if the order
does not require extensive or customized processing. These services save time, labor, and expense
for our customers and reduce their overall manufacturing costs. During 2005, we handled
approximately 9,700 transactions per business day, with average revenues of approximately $1,370
per transaction. Our total revenues for 2005 were $3.4 billion. We believe that our focus on
small orders with quick turnaround differentiates us from many of the other large public metals
service center companies and allows us to generate higher profits than those companies.
Historically, we have expanded both through acquisitions and internal growth. Since our
initial public offering in September 1994, we have successfully purchased more than 30 businesses.
From 1984 to September 1994, we acquired 20 businesses. We continue to evaluate acquisition
opportunities and expect to continue to grow our business through acquisitions and internal growth
initiatives.
Acquisitions
On July 1, 2005, we acquired all of the outstanding capital stock of Chapel Steel Corp.
(“Chapel Steel”), a privately held metals service center company founded in 1972 that processes and
distributes carbon and alloy steel plate products from five facilities in Pottstown (Philadelphia),
Pennsylvania; Bourbonnais (Chicago), Illinois; Houston, Texas; Birmingham, Alabama; and Portland,
Oregon. Chapel Steel also warehouses and distributes its products in Cincinnati, Ohio and Hamilton,
Ontario, Canada. Chapel Steel is headquartered in Spring House (Philadelphia), Pennsylvania. We
paid approximately $94.2 million in cash for the equity of Chapel Steel and assumed approximately
$16.8 million of Chapel Steel’s debt. Chapel Steel’s net sales for the six months ended December
31, 2005 were approximately $131 million.
Pending Merger with Earle M. Jorgensen Company
In January 2006, we jointly announced with Earle M. Jorgensen Company (“EMJ”) that we have
entered into a definitive merger agreement pursuant to which we will acquire EMJ for approximately
$13.00 per share in cash and stock, subject to a collar, which establishes the minimum and maximum
of our stock to be issued. If the transaction successfully closes,
EMJ will be merged with and into a wholly-owned subsidiary of Reliance.
3
Table of Contents
The transaction is valued at
approximately $934 million, including the assumption of EMJ’s net debt. EMJ’s revenues for their
fiscal year ended March 31, 2005 were approximately $1.6 billion. The consideration to EMJ
stockholders will be paid approximately 50% in our common stock and 50% in cash. Under the terms of
the merger agreement, EMJ stockholders will have the right to receive consideration of $6.50 in
cash and a number of shares of our common stock equal to about $6.50, depending on the average
price of our stock at closing and the resulting exchange ratio. The exchange ratio will not be
more than 0.1207 and not less than 0.0892 shares of Reliance common stock, for each share of EMJ
stock outstanding. If the average price of our common stock for the 20 trading days ending on and
including the second trading day prior to the closing is between $53.86 and $72.86 per share, the
value of the Reliance common stock received would be $6.50 for each EMJ share. The cash portion,
which includes the cash out of certain EMJ options and estimated transaction costs, will be
financed under Reliance’s $600 million syndicated credit facility that will be increased to $700
million as of the closing of the transaction. Additionally, the Company will assume EMJ’s existing
long-term debt.
The proposed merger with EMJ must be approved by EMJ’s stockholders. A special meeting of
stockholders has been scheduled for March 31, 2006. Reliance has entered into a voting agreement
with holders of 50.1% of EMJ’s outstanding common stock that provides that such holders will vote
for the merger, subject to certain termination rights. These stockholders would also be entitled
to certain registration rights for their Reliance shares if the merger is approved.
Pending Acquisition
In February 2006, we entered into a purchase agreement, through Precision Strip, Inc.
(“Precision Strip”), a wholly owned subsidiary, to acquire certain assets and business of Flat Rock
Metal Processing, LLC. (“Flat Rock”). Flat Rock is a toll processing company. Precision Strip
will operate the Flat Rock businesses in Perrysburg, Ohio and Eldridge, Iowa, pending successful
completion of due diligence and closing of the transaction.
Recent Developments
In
October 2005, we formed Reliance Pan Pacific Pte., Ltd. (“RPP”) with our joint venture
partner Manufacturing Network Pte. Ltd. (“MNPL”). We own 70% of RPP and MNPL owns the remaining
30%. On March 1, 2006, RPP acquired 100% of the outstanding equity interest in Everest Metals
(Suzhou) Co., Ltd. (“Everest Metals”), a metals service center company near Shanghai, People’s
Republic of China. Everest Metals sells aluminum products to the Chinese electronics market and
had 2005 sales of approximately $5.5 million. Everest Metals was previously wholly owned by MNPL.
In January 2006, we purchased the remaining 49.5% of American Steel, L.L.C. From its
inception on July 1, 1995 through April 30, 2002, we owned a 50% interest in the Membership Units
of American Steel, which operates metals service centers in Portland, Oregon and Kent, Washington
and processes and distributes primarily carbon steel products. We retained operating control over
the assets and operations of American Steel and American Industries, Inc. owned the other 50%
interest. Effective May 1, 2002, we increased our ownership to 50.5% of the outstanding Membership
Units of American Steel and began consolidating its financial results. The 2005 net sales of
American Steel were approximately $107 million.
Valex Corp., our 97%-owned subsidiary, is a leading domestic manufacturer of electropolished
stainless steel tubing and fittings primarily used in the construction and maintenance of
semiconductor manufacturing plants. In 2005, Valex Corp. dissolved its French subsidiary due to
reduced European demand. Also in 2005, Valex closed its distribution centers in Santa Clara,
California and Portland, Oregon because the semiconductor chip manufacturing industry that Valex
serves has experienced a significant shift to Asia. Valex Korea Co., Ltd., a wholly-owned
subsidiary of Valex Corp., based near Seoul, increased its sales significantly as a result and is
in the process of expanding its facility. Furthermore, in 2005, Valex opened a distribution center
in New Hampshire to service a large customer in the New England area.
In 2005, AMI Metals Europe, SPRL, opened a sales office in France and is currently in the
process of expanding its warehouse facility in Belgium to better service its increased share of the
European aerospace business. In 2006, Liebovich Bros. opened a new location near Green Bay,
Wisconsin to further penetrate that geographic area. Phoenix Metals Company opened a new location
near Cincinnati, Ohio in 2005 and opened another facility near Philadelphia, Pennsylvania in 2006
as new entries into these geographic regions. Phoenix Metals also purchased a new, larger, more
efficient facility in Birmingham, Alabama and is building a new facility for its Charlotte, North
Carolina operation to better support its customers in those areas.
Allegheny Steel Distributors is
in the process of expanding its Indianola, Pennsylvania facility to make room for additional
equipment which is being installed to help support its increased business. Also Siskin Steel &
Supply Co. is expanding its Chattanooga, Tennessee warehouse and Precision Strip is expanding its
Talladega, Alabama facility.
We formed RSAC Management Corp., a California corporation, in 1999 to operate as a holding
company for our subsidiaries and to provide administrative and management services to our metals
service centers. Our executive officers maintain a control environment that is focused on integrity and ethical behavior, establish
general policies and operating guidelines and monitor adherence to proper financial controls, while
our division managers and subsidiary officers have virtual autonomy with respect to day-to-day
operations.
4
Table of Contents
This balanced, yet entrepreneurial, management style has enabled us to improve the
productivity and profitability both of acquired businesses and of our own expanded operations.
Division managers and other management personnel are eligible for incentive compensation based, in
part, on the profitability of their particular division or subsidiary and, in part, on the
Company’s overall profitability.
We seek to increase our profitability by expanding our existing operations and acquiring
businesses that diversify or enhance our customer base, product range, processing services and
geographic coverage. We have developed and maintained an excellent reputation in the industry for
our integrity and the quality and timeliness of our service to customers.
Customers
Our customers purchase from us and other metals service centers to obtain value-added metals
processing, readily available inventory, reliable and timely delivery, flexible minimum order size
and quality control. Many of our customers deal exclusively with service centers because the
quantities of metal products that they purchase are smaller than the minimum orders specified by
mills, or because those customers require intermittent deliveries over long or irregular periods,
or because those customers require specialized processing services. We believe that metals service
centers have also enjoyed an increasing share of total metal shipments due to the focus of the
capital goods and other manufacturing industries on just-in-time inventory management and materials
management outsourcing, and because metal producers have reduced in-house direct sales efforts to
small sporadic purchasers in order to enhance their production efficiency.
We have more than 95,000 metals service center customers in various industries. In 2005, no
single customer accounted for more than 1% of our sales, and more than 85% of our orders were from
repeat customers. Our customers are manufacturers and end-users in the general manufacturing,
construction (both commercial and residential), transportation (rail, truck and auto), aerospace,
and semiconductor fabrication and related industries. In 2003, many of our suppliers also became
our customers as a result of our purchase of Precision Strip, which typically sells processing
services to larger customers, such as mills and original equipment manufacturers (OEM’s), and in
larger annual volumes than we have experienced historically. Precision Strip has also indirectly
increased our participation in the auto and appliance end markets. Our metals service centers
wrote and delivered over 2,450,000 orders during 2005 at an average price of approximately $1,370.
Most of our metals service center customers are located within a 200-mile radius of the metals
service center serving them. The proximity of our centers to our customers helps us provide
just-in-time delivery to our customers. With our fleet of approximately 815 trucks (some of which
are leased), we are able to service many smaller customers. Moreover, our computerized order entry
system and flexible production scheduling enable us to meet customer requirements for short lead
times and just-in-time delivery. Approximately 4% of our sales were to international customers in
2005, with approximately 69% of these sales from our AMI Metals and Valex international locations
serving the European and Asian markets.
We believe that our long-term relationships with many of our customers significantly
contribute to the success of our business. Providing prompt and efficient services and quality
products at reasonable prices are important factors in maintaining these relationships.
Customer demand may change from time to time based on, among other things, general economic
conditions and industry capacity. Many of the industries in which our customers compete are
cyclical in nature. Because we sell to a wide variety of customers in several industries, we
believe that the effect of such changes on us is significantly reduced. However, from 2001 through
August 2003, we experienced lower sales levels due to a broad-based economic downturn that affected
all industries. We experienced lower demand in each successive year from 2000 until September 2003
when we experienced an improvement in our customer demand, as well as pricing, for most of the
products we sell. Customer demand levels continued to increase in 2004. In 2005, demand rose for
some of our products (primarily those related to aerospace) and for other products was fairly
steady with 2004 levels.
Pricing for carbon steel products increased to record highs in 2004, primarily due to raw
material shortages for the mills that increased their costs, and due to reduced supply resulting
from the shutdown of some domestic capacity and from increased global demand that reduced the
amount of import material available in the U.S. as it was re-routed to strong foreign markets such
as China. Pricing for aluminum and stainless steel products also increased steadily throughout the
year as demand increased, especially for aerospace products. There were significant and rapid
increases for both pricing and demand of aerospace products throughout 2005.
California was our largest market for many years, but we have expanded our geographic coverage
in recent years and the Southeast region of the United States has become our largest market.
Although our sales dollars in each of these regions have increased, the percent of total sales in
each region has changed due to the Company’s growth. California
represented 21% of our 2005 sales, which was a significant decrease from 45% of our 1997 sales. The Southeast region
of the United States represented 25% of our 2005 sales compared to 18% of our 1997 sales, and the
Midwest region, which we entered in 1999, represented 20% of our 2005 sales.
5
Table of Contents
Suppliers
We purchase our inventory from the major metals mills, both domestic and foreign, and have
multiple suppliers for all of our product lines. Our major suppliers of domestic carbon steel
products include California Steel Industries, Inc., Chaparral Steel Company, IPSCO, Inc., Mittal
Steel, Nucor Corporation, Oregon Steel Mills, Steel Dynamics, Inc., United States Steel Corporation
and USS-POSCO Industries. Allegheny Technologies Incorporated, International Stainless Steel Co.
and North American Stainless supply stainless steel products. We are a recognized distributor for
various major aluminum companies, including Alcoa Inc, Alcan Aluminum Limited, Aleris
International, Inc. (formerly Commonwealth Aluminum Corp.) and Kaiser Aluminum Corp.
During 2001 through 2003, many domestic steel mills entered bankruptcy proceedings and certain
of those mills temporarily closed a portion of their production capacity. Beginning in 2003 and
continuing into 2004, many of the bankrupt mill facilities were acquired and some production was
re-started. Mill pricing for steel products stabilized in mid-2003 mainly because of the
consolidation that occurred at the mill level that improved capacity and mill-pricing discipline.
Beginning in late 2003, steel mills began to experience significant increases in their raw material
costs due to shortages caused by increased global demand. In 2004 they instituted surcharges on
top of base price increases and consistently implemented significant increases through most of
2004. In 2005, the domestic mills exercised pricing discipline by shutting down excess capacity,
when appropriate, which provided a more stable pricing environment than our industry has
experienced historically. Costs for aluminum and stainless steel products continued to increase
steadily throughout 2004 and 2005. Costs for aerospace products increased significantly in 2005
due to limited supply caused by strong demand, and due to increased raw material costs.
Because of our total volume of purchases and our long-term relationships with our suppliers,
we believe that we were able to purchase inventory at the best prices offered by the suppliers,
given the order size. We believe that we are not dependent on any one of our suppliers for metals
and that our relationships with our suppliers are very strong. We have worked closely with our
suppliers in order to become an important customer for each major supplier of metals for our core
product lines. In 2004, when carbon steel supply was tight, we believe that these relationships
provided an advantage to us in our ability to source product and have it available for our
customers. However, a significant increase in global steel and aluminum usage together with raw
material shortages and supply constraints may cause difficulties for metals service centers,
including us, and their customers, to obtain the volume of metal desired. Also, mill consolidation
has somewhat reduced the number of suppliers available to us.
Backlog
Because of the just-in-time delivery policy and the short lead-time nature of our business, we
do not believe the information on backlog of orders is material to an understanding of our metals
service center business.
Products and Processing Services
We provide a wide variety of processing services to meet each customer’s specifications and
deliver products to fabricators, manufacturers and other end users. We maintain a wide variety of
products in inventory. For orders other than those requiring extensive or specialized processing,
we often deliver to the customer within 24 hours after receiving the order. Our 2005 sales were
comprised of the following approximate percentages:
| • | 15% carbon steel plate | ||
| • | 10% heat-treated aluminum plate, sheet and coil | ||
| • | 9% carbon steel structurals | ||
| • | 9% stainless steel plate, sheet and coil | ||
| • | 8% carbon steel tubing | ||
| • | 8% galvanized steel sheet and coil | ||
| • | 7% common alloy aluminum plate, sheet and coil | ||
| • | 6% carbon steel bar | ||
| • | 6% hot rolled steel sheet and coil | ||
| • | 6% miscellaneous, including brass, copper and titanium | ||
| • | 4% aluminum bar and tube | ||
| • | 4% stainless steel bar and tube | ||
| • | 4% toll processing of aluminum, carbon steel and stainless steel | ||
| • | 3% cold rolled steel sheet and coil | ||
| • | 1% electropolished stainless steel tubing and fittings |
6
Table of Contents
We do not depend on any particular customer group or industry because we process a variety of
metals. Because of this diversity of product type and material, we believe that we are less
exposed to fluctuations or other weaknesses in the financial or economic stability of particular
customers or industries. We also are less dependent on particular suppliers.
For our largest product type (sheet and coil), we purchase coiled metal from primary producers
in the form of a continuous sheet, typically 36 to 60 inches wide, between .015 and .25 inches
thick, and rolled into 3- to 20-ton coils. The size and weight of these coils require specialized
equipment to move and process the coils into smaller sizes and various products. Few of our
customers have the capability of processing the metal into the desired products.
After receiving an order, we enter it into our computerized order entry system, select
appropriate inventory and schedule the processing to meet the specified delivery date. More than
50% of our orders specify delivery within 24 hours. We attempt to maximize the yield from the
various metals that we process by combining customer orders to use each purchased product to the
fullest extent practicable.
Few metals service centers offer the full scope of processing services and metals that we
provide. In 2005, approximately 45% of our sales orders required us to perform processing
services. Our primary processing services are described below:
| • | Bar turning involves machining a metal bar into a smaller diameter. | ||
| • | Bending is the forming of metals into various angles. | ||
| • | Blanking is the cutting of metals into close-tolerance square or rectangular shapes. | ||
| • | Deburring is the process used to smooth the sharp, jagged edges of a cut piece of metal. | ||
| • | Electropolishing is the process used on stainless steel tubing and fittings to simultaneously smooth, brighten, clean and passivate the interior surfaces of these components. Electropolishing is an electrochemical removal process that selectively removes a thin layer of metal, including surface flaws and imbedded impurities. Electropolishing is a required surface treatment for all ultra high-purity components used in the gas distribution systems of semiconductor manufacturers worldwide and many sterile water distribution systems of pharmaceutical and biotechnology companies. | ||
| • | Fabricating includes performing second- and/or third-stage processing per customer specifications, typically to provide a part, casing or kit which is used in the customer’s end product. | ||
| • | Forming involves bending and forming plate or sheet products into customer-specified shapes and sizes with press brakes. | ||
| • | Grinding or blanchard grinding involves grinding the top and/or bottom of carbon or alloy steel plate or bars into close tolerance. | ||
| • | Leveling (cutting-to-length) involves cutting metal along the width of a coil into specified lengths of sheets or plates. | ||
| • | Machining refers to performing multiple processes to a piece of metal to produce a customer-specified component part. | ||
| • | Oscillate slitting involves slitting the metal into specified widths and then oscillating the slit coil when it is wound. The oscillated coil winds the strip metal similar to the way fishing line is wound on a reel rather than standard ribbon winding. An oscillate coil can typically hold five to six times more metal than a standard coil, which allows customers to achieve longer production run times by reducing the number of equipment shut-downs to change coils. | ||
| • | Pipe threading refers to the cutting of threads around the circumference of the pipe. | ||
| • | Polishing changes the texture of the surface of the metal to specific finishes in accordance with customer specifications. | ||
| • | Precision plate sawing involves sawing plate (primarily aluminum plate products) into square or rectangular shapes to tolerances as close as 0.003 of an inch. | ||
| • | Punching is the cutting of holes into carbon steel beams or plates by pressing or welding per customer specifications. | ||
| • | Routing produces various sizes and shapes of aluminum plate according to customer-supplied drawings through the use of CNC controlled machinery. | ||
| • | Sawing involves cutting metal into customer-specified lengths, shapes or sizes. | ||
| • | Shape cutting, or burning, can produce various shapes according to customer-supplied drawings through the use of CNC controlled machinery. This procedure can include the use of oxy-fuel, plasma, high-definition plasma, laser burning or water jet cutting for carbon, aluminum and stainless steel sheet and plate. | ||
| • | Shearing is the cutting of metal into small, precise pieces. | ||
| • | Skin milling grinds the top and/or bottom of a large aluminum plate into close tolerance. |
7
Table of Contents
| • | Slitting involves cutting metal to specified widths along the length of the coil. | ||
| • | Tee splitting involves splitting metal beams. Tee straightening is the process of straightening split beams. | ||
| • | Twin milling grinds one or all six sides of a small square or rectangular piece of aluminum plate into close tolerance. | ||
| • | Welding is the joining of one or more pieces of metal. | ||
| • | Wheelabrating, shotblasting and bead-blasting involve pressure blasting metal grid onto carbon steel products to remove rust and scale from the surface. |
We generally process specific metals to non-standard sizes only at the request of customers
pursuant to purchase orders. We do not maintain a significant inventory of finished products, but
we carry a wide range of metals to meet the short lead time and just-in-time delivery requirements
of our customers. Our metals service centers maintain inventory and equipment selected to meet the
needs of that facility’s customers.
Marketing
We have approximately 790 sales personnel located in 38 states, Belgium, China, France and
South Korea that provide marketing services throughout each of those areas, as well as nearby
locations. The sales personnel are organized by division or subsidiary among our profit centers
and are divided into two groups. We consider those sales personnel who travel throughout a
specified geographic territory to maintain relationships with our existing customers and develop
new customers our outside sales personnel. Those sales personnel who remain at the facilities to
write and price orders are our inside sales personnel. The inside sales personnel generally
receive incentive compensation, in addition to their base salary, based on the gross profit or
pretax profit of their particular profit center. The outside sales personnel generally receive
incentive compensation based on the gross profit from their particular geographic territories.
50.5%-Owned Company
Beginning July 1, 1995, we owned 50% and had operational control of American Steel, L.L.C., an
Oregon limited liability company. American Steel operates metals service centers in Portland,
Oregon, and Kent, Washington. Effective May 1, 2002, we increased our ownership interest to 50.5%
and amended the Operating Agreement to eliminate all super-majority and unanimous voting rights,
among other things. There was no cost involved in this transaction, which was completed to
facilitate the renewal of American Steel’s credit agreement. American Industries, Inc. owned the
other 49.5% of American Steel until we purchased this interest on January 3, 2006. From July 1,
1995 through April 30, 2002, we accounted for our 50% investment in American Steel by the equity
method, and included 50% of American Steel’s earnings in our net income and earnings per share
amounts. Beginning May 1, 2002, we consolidated American Steel’s financial results and recorded
American Industries’ 49.5% ownership as minority interest. Beginning January 3, 2006, we include
100% of American Steel’s earnings in our consolidated financial results.
Industry and Market Cycles
We distribute metal products to our customers in a variety of industries, including
manufacturing, construction, transportation, aerospace and semiconductor fabrication. Many of the
industries our customers compete in are cyclical in nature and are subject to changes in demand
based on general economic conditions. We sell to a wide variety of customers in diverse industries
to reduce the effect of changes in these cyclical industries on our results. During the 2001 and
2002 years and until August 2003, all of the industries that we sell to experienced low demand
levels due to the poor economic conditions in the U.S. Demand for our products improved beginning
in September 2003 and the improvement continued through most of 2004 and 2005 for some of our
products. Our results were significantly impacted by the economic downturn from 2001 through 2003,
but reacted positively to the favorable pricing environment in 2004, for all of our products, and
2005, for our aerospace related products, resulting in record profitability levels for each of
those years. A significant drop in current pricing levels or demand could result in a negative
impact to our financial results. However, if current pricing levels do not change significantly
and demand improves, our financial results could be positively impacted.
The semiconductor fabrication industry, aerospace industry and truck trailer and rail car
industries have historically experienced cycles that may have an impact on our results if they
repeat in the future. The semiconductor fabrication industry is highly cyclical in nature and is
subject to changes in demand based on, among other things, general economic conditions and industry
capacity. There has been a substantial shift in this market, with many U.S. companies moving their
semiconductor fabrication operations to Asia. We are participating in the Asian market through our
Valex Korea subsidiary and our recent acquisition of Everest Metals in China.
In 2003, aerospace demand remained fairly consistent with the low levels experienced in 2002,
but in 2004 we experienced steady improvement throughout the year. Aerospace demand, as well as
pricing, increased rapidly and significantly throughout 2005. We anticipate that aerospace demand
will remain strong through 2006.
8
Table of Contents
The heavy truck, truck trailer and rail car industries experienced a substantial slowing in
demand beginning in 2000 that continued through 2002, which materially impacted our operations in
the Pacific Northwest. We did experience some improvement for short periods during 2003 and saw
significant improvements in truck trailer demand throughout 2004 that continued at healthy levels
in 2005.
Fluctuations in the cost of our materials also affect the prices we can charge to our
customers. By selling a diverse product mix, we are able to somewhat offset fluctuations in our
costs of materials. However, during 2001, metals costs of most products reached their lowest
levels experienced in over 20 years. This occurred due to overcapacity at the producer level in
both domestic and foreign markets, along with the weak demand experienced in 2001. Due to the
continued low demand, costs of most metals remained at or near the 2001 levels throughout 2002 and
most of 2003. However, costs of carbon steel flat-rolled products increased significantly in the
second half of 2002 due to supply constraints, as certain producers reduced capacity and because of
government restrictions on foreign imports. These increased costs began to decline slightly near
the end of 2002 and early 2003 because of the continued low end-user demand. In the second half of
2003, costs for carbon steel products again increased significantly and rapidly due to improved
demand and increased scrap, raw material and energy costs for steel producers. This trend
continued through most of 2004, with pricing at all time highs. Increased global demand limited
availability of many of these products in the U.S. allowing the significant increases in costs.
During the fourth quarter of 2004, increased amounts of import material arrived in the U.S. putting
some downward pressure on pricing for carbon steel products. In the first eight months of 2005,
there was downward pressure on carbon steel prices which we believe was mainly due to excess
inventory in the supply chain. Costs for aluminum and stainless steel products increased in the
second half of 2003 and throughout 2004 and 2005 due to supply constraints and improved customer
demand. Pricing for aerospace related aluminum, stainless steel and titanium products experienced
significant cost increases in 2005 due to improved demand and supply constraints.
We have historically been able to pass increases in metal costs on to our customers as costs
typically increase due to strong demand. In 2004, supply limitations for carbon steel products
allowed us to pass through significant cost increases well in advance of our receipt of the higher
cost material, which resulted in significantly higher gross profit margins in 2004, especially in
the 2004 second quarter. Our gross profit margins declined somewhat from 2004 levels in 2005
because of declining costs during the first eight months of 2005. However, due to increased costs
announced in August 2005, our gross profit margins improved in the 2005 fourth quarter. Also, due
to supply limitations, we were able to increase our selling prices for aerospace products more than
our costs increased, raising our 2005 gross profit margins for these products. We cannot guarantee
that the margin between our metal costs and selling prices will remain at the levels experienced
during 2005, especially if demand declines or does not improve and if costs of domestic metals
decline due to increased availability or reduced global demand. If metals costs and related
selling prices remain at current levels or increase, we should be able to record increased revenue
and gross profit dollars on a consistent volume basis.
Competition
The metals distribution industry is highly fragmented and competitive. We have numerous
competitors in each of our product lines and geographic locations, although competition is most
frequently local or regional. Most of our competitors are smaller than we are, but we still face
strong competition from national, regional and local independent metals distributors and the
producers themselves, some of which have greater resources than we do. As reported in the May 2003
issue of Purchasing magazine, it is estimated that there were approximately 3,500 intermediate
steel processors and metals service center facilities in North America in 2003. Industry magazines
have identified us as the second largest metals service center company in North America (based upon
2004 revenue). According to the May 2005 issue of the magazine Purchasing, the 2004 (most recent
year available) revenues for the five largest North American metals service center companies ranged
from $1.9 billion to $3.3 billion for total revenues of $12.3 billion, which represents
approximately 14% of the estimated $85 billion of total revenue for the metals service center
industry in 2004. Reliance’s 2004 sales of $2.9 billion represented approximately 3% of the
estimated $85 billion industry total. We compete with other companies on price, service, quality
and availability of products. We maintain centralized relationships with our major suppliers and a
decentralized operational structure. We believe that this division of responsibility has increased
our ability to obtain competitive prices of metals and to provide more responsive service to our
customers. In addition, we believe that the size of our inventory, the different metals and
products we have available, and the wide variety of processing services we provide distinguish us
from our competition. We believe that we have increased our market share during recent years due
to our strong financial condition, as many of our competitors were facing capital constraints.
Quality Control
Procuring high quality metal from suppliers on a consistent basis is critical to our business.
We have instituted strict quality control measures to assure that the quality of purchased raw
materials will enable us to meet our customers’ specifications and to reduce the costs of
production interruptions. We perform physical and chemical analyses on selected raw materials to
verify that their mechanical and dimensional properties, cleanliness and surface characteristics
meet our requirements. We conduct similar analyses on selected processed metal before delivery to
the customer. We believe that maintaining high standards for accepting metals ultimately results
in reduced return rates from our customers.
9
Table of Contents
Nineteen divisions and six subsidiaries of Reliance, at a total of 36 facilities, have
maintained ISO 9002 certifications and were recertified for ISO 9001-2000, but we have determined
not to obtain the certification for any additional facilities at this time. As of December 15,
2003, ISO 9001-2002 replaced ISO 9002. The ISO 9001-2000 quality standard has added a matrix to
record and review customer satisfaction and has reorganized the requirements for the quality
standard from 20 elements to eight elements. The certification takes approximately one year to
obtain. Each facility seeking ISO certification is required to establish a quality system that is
documented in a quality control manual and that affects all aspects of the facility’s operations,
including sales, product inspections, product storage, delivery and documentation. A certifying
agent performs a physical audit of each facility every six months to determine that the facility is
in fact following the procedures set forth in the quality control manual. A recertification is
required for each facility every three years. Initially in 1996, when we first began the
certification process, we expected that more customers would require such certification, but we
have learned that for the types of products and services which most of our facilities provide, very
few of our customers require such certification and most of our customers have responded that they
would purchase products from Reliance or its subsidiaries regardless of such certification.
However, we believe that going through the certification process allowed our facilities to improve
their efficiency and the quality of products and services provided to our customers.
In addition, our subsidiary Precision Strip maintains ISO/TS 16949:2002 certifications at its
eight facilities. ISO/TS 16949:2002 is an ISO Technical Specification, which aligns existing
American (QS-9000), German (VDA6.1), French (EAQF) and Italian (AVSQ) automotive quality systems
standards within the global automotive industry. Quality System Requirements QS-9000 (“QS-9000”)
is the common quality standard for automotive suppliers and is based upon the 1994 edition of ISO
9001, with additional requirements specific to the automotive industry. The International
Automotive Sector Group is an international ad hoc working group that monitors interpretation
issues related to the standard.
Systems
We have converted our Reliance divisions and certain of our subsidiaries from various software
programs to the StelplanÔ manufacturing and distribution information system. StelplanÔ
is a registered trademark of Invera, Inc. StelplanÔ is an integrated business application
system with functions ranging from order entry to the generation of financial statements.
StelplanÔ was developed specifically for the metals service center and processor industry.
StelplanÔ also provides information in real time, such as inventory availability, location
and cost. With this information, our marketing and sales personnel can respond to our customers’
needs more efficiently and more effectively.
Certain of our subsidiaries use other vendor or in-house developed systems to support their
operations. The basic functionality of the software is similar to StelplanÔ. A common
financial reporting system is used company-wide.
Government Regulation
Our metals service centers are subject to many federal, state and local requirements to
protect the environment, including hazardous waste disposal and underground storage tank
regulations. The only hazardous wastes that we use in our operations are lubricants and cleaning
solvents. We frequently examine ways to minimize any impact on the environment and to effect cost
savings relating to environmental compliance. We pay state-certified private companies to haul and
dispose of our hazardous waste.
Our operations are also subject to laws and regulations relating to workplace safety and
worker health, principally the Occupational Health and Safety Act and related regulations, which,
among other requirements, establish noise, dust and safety standards. We have a very strict safety
policy, which we believe is one of the best in the industry. We are in material compliance with
applicable laws and regulations and do not anticipate that future compliance with such laws and
regulations will have a material adverse effect on our results of operations or financial
condition.
Environmental
We have no material outstanding unresolved issues with environmental regulators, and our
products and processes present no environmental concerns. We do not expect any material
expenditures to meet environmental requirements. Some of the properties we own or lease are
located in industrial areas, however, with histories of heavy industrial use. We may incur some
environmental liabilities because of the location of these properties. Any such liabilities would
arise from causes other than our operations, but we do not expect that these liabilities would have
a material adverse impact on our results of operations, financial condition or liquidity.
10
Table of Contents
Employees
As of December 31, 2005, we had approximately 5,600 employees. Approximately 694 employees
are covered by collective bargaining agreements, which expire at various times over the next four
years. We have entered into collective bargaining agreements with 19 union locals at 20 of our
locations. These collective bargaining agreements have not had a material impact either favorably
or unfavorably on our revenues or profitability at our various locations. We have always
maintained excellent relations with our employees. In 2005, we experienced a work stoppage by our
drivers at one of our locations, but it did not have a material impact on our operations at this
location. This contract expired and the drivers at that location are now non-union employees. We
have never experienced a significant work stoppage.
Available Information
We file annual, quarterly and current reports, proxy statements and other documents with the
Securities and Exchange Commission (“SEC”) under the Securities Exchange Act of 1934, as amended
(“the Exchange Act”). The public may read and copy any materials that we file with the SEC at the
SEC’s Public Reference Room at 450 Fifth Street, N.W., Washington, DC 20549. The public may obtain
information on the operation of the Public Reference Room by calling the SEC at 1-800-SEC-0330.
Also, the SEC maintains a Website that contains reports, proxy information statements and other
information regarding issuers, including our Company, that file electronically with the SEC. The
public can obtain any documents that we file with the SEC at http://www.sec.gov.
We also make available free of charge on or through our Internet Website
(http://www.rsac.com) our Annual Report on Form 10-K, Quarterly Reports on Form 10-Q,
Current Reports on Form 8-K and, if applicable, amendments to those reports filed or furnished
pursuant to Section 13(a) of the Exchange Act as soon as reasonably practicable after we
electronically file such material with, or furnish it to, the SEC. Reference to our Website is not
intended to incorporate anything on the Website into this report.
Item 1A. Risk Factors
Set forth below are the risks that we believe are material to our investors. This section contains
forward-looking statements. You should refer to the explanation of the qualifications and
limitations on forward-looking statements set forth at the beginning of this Report.
The value of your investment may be subject to sudden decreases due to the potential volatility of
the price of our common stock.
The market price of our common stock may be highly volatile and subject to wide fluctuations in
response to various factors, including variations in our quarterly results of operations. Other
factors may include matters discussed in other risk factors and the following factors:
| • | changes in expectations as to our future financial performance, including financial estimates by securities analysts and investors; | ||
| • | developments affecting our Company, our customers or our suppliers; | ||
| • | changes in the legal or regulatory environment affecting our business; | ||
| • | press releases, earnings releases or publicity relating to us or our competitors or relating to trends in the metals service center industry; | ||
| • | inability to meet securities analysts’ and investors’ quarterly or annual estimates or targets of our performance; | ||
| • | the operating and stock performance of other companies that investors may deem comparable; | ||
| • | sales of our common stock by large shareholders; | ||
| • | general domestic or international economic, market and political conditions. |
These factors may adversely affect the trading price of our common stock, regardless of our
actual operating performance. In addition, the stock markets from time to time experience extreme
price and volume fluctuations that may be unrelated or disproportionate to the operating
performance of companies. In the past, some shareholders have brought
securities class action lawsuits against companies following periods of volatility in the market price of their securities.
We may in the future be the target of similar litigation. Securities litigation, regardless of
whether our defense is ultimately successful, could result in substantial costs and divert
management’s attention and resources.
11
Table of Contents
Our indebtedness could impair our financial condition and reduce the funds available to us for
other purposes and our failure to comply with the covenants contained in our debt instruments could
result in an event of default that could adversely affect our operating results.
We have substantial debt service obligations. As of December 31, 2005, we had aggregate
outstanding indebtedness of approximately $350.8 million. Upon successful completion of the EMJ
merger, our indebtedness will increase. This indebtedness could adversely affect us in the
following ways:
| • | our ability to obtain additional financing in the future for working capital, capital expenditures, acquisitions, general corporate purposes or other purposes may be impaired; | ||
| • | a significant portion of our cash flow from operations must be dedicated to the payment of interest and principal on our debt, which reduces the funds available to us for our operations or other purposes; | ||
| • | some of our debt is, and will continue to be, at variable rates of interest, which may result in higher interest expense in the event of increases in interest rates; | ||
| • | because we may be more leveraged than some of our competitors, our debt may place us at a competitive disadvantage; | ||
| • | our leverage may increase our vulnerability to economic downturns and limit our ability to withstand adverse events in our business by limiting our financial alternatives; | ||
| • | after completion of the EMJ merger, EMJ’s noteholders or our lenders could require us to repurchase EMJ’s 9.75% notes, which would limit our access to funds for growth initiatives; | ||
| • | our ability to capitalize on significant business opportunities, including potential acquisitions, and to plan for, or respond to, competition and changes in our business may be limited. |
Our debt agreements contain, and any agreements to refinance our debt likely would contain,
financial and restrictive covenants that limit our ability to incur additional debt, including to
finance future operations or other capital needs, and to engage in other activities that we may
believe are in our long-term best interests, including to dispose of or acquire assets or other
companies or to pay dividends to our shareholders. Our failure to comply with these covenants may
result in an event of default which, if not cured or waived, could accelerate the maturity of our
indebtedness or prevent us from accessing availability under our credit facility. If our
indebtedness is accelerated, we may not have sufficient cash resources to satisfy our debt
obligations and we may not be able to continue our operations as planned.
We may not be able to generate sufficient cash flow to meet our debt service obligations.
Our annual debt service obligations until June 11, 2010, when our revolving credit facility is
expected to mature, will be primarily limited to interest and principal payments on our senior
notes (with the principal payable only as and when they mature), on our credit facility, on our
industrial revenue bonds and on any debt we assume in connection with the EMJ merger. Our ability
to generate sufficient cash flow from operations to make scheduled payments on our debt obligations
will depend on our future financial performance, which will be affected by a range of economic,
competitive and business factors, many of which are outside of our control. For example, we may
not generate sufficient cash flow from operations to repay our credit facility when it matures in
2010, or our senior notes when they mature on various dates between 2006 and 2013 or our industrial
revenue bonds when they mature in 2009 and 2014 or the EMJ 9.75% notes when they mature or
are required to be repurchased. If we do not generate sufficient cash flow from operations to
satisfy our debt obligations, we expect to undertake alternative financing plans, such as
refinancing or restructuring our debt, selling assets, reducing or delaying capital investments or
seeking to raise additional capital. We may not be able to consummate any such transaction at all
or on a timely basis or on terms, and for proceeds, that are acceptable to us. Furthermore, these
transactions may not be permitted under the terms of our various debt instruments then in effect.
Our inability to generate sufficient cash flow to satisfy our debt obligations, or to timely
refinance our obligations on acceptable terms, could aversely affect our ability to serve our
customers and could cause us to discontinue our operations as planned. Our credit facility is
unsecured.
12
Table of Contents
The costs that we pay for metals may fluctuate due to a number of factors beyond our control,
which, on a combined basis, could adversely affect our operating results if we cannot pass on
higher metal prices to our customers.
We purchase large quantities of carbon, alloy, stainless steel, aluminum and other metals,
which we sell to a variety of end-users. In 2004 the costs for carbon steel increased significantly
and rapidly from historic levels. Although these costs declined somewhat through mid-2005, the
costs increased in the fourth quarter of 2005 and overall carbon steel costs remained at
historically high levels. Costs for aluminum and stainless steel products, excluding
aerospace-related products, rose steadily in 2004 and there were some continued increases in 2005.
Costs for aerospace-related products have increased significantly beginning in late 2004 and
continued to increase through all of 2005. We attempt to pass these cost increases on to our
customers with higher selling prices. The costs to us for these metals and the prices that we
charge customers for our products may change depending on many factors outside of our control,
including general economic conditions (both domestic and international), competition, production
levels, customer demand levels, import duties and other trade restrictions, currency fluctuations
and surcharges imposed by our suppliers.
We maintain substantial inventories of metal to accommodate the short lead times and delivery
requirements of our customers. Accordingly, we purchase metal in quantities we believe to be
appropriate to satisfy the anticipated needs of our customers based on information derived from
customers, market conditions, historic usage and industry research. Commitments for metal purchases
are generally at prevailing market prices in effect at the time orders are placed or at the time of
shipment. During periods of rising prices for metal, we may be negatively impacted by delays
between the time of increases in the cost of metals to us and increases in the prices that we
charge for our products if we are unable to pass these increased costs on to our customers. In
addition, when metal prices decline, customer demands for lower prices could result in lower sale
prices for our products and, as we use existing inventory that we purchased at higher metal prices,
lower margins. Consequently, during periods in which we use this existing inventory, the effects of
changing metal prices could adversely affect our operating results.
The price of metals is subject to fluctuations in the supply and demand for metals worldwide and
changes in the worldwide balance of supply and demand could negatively impact our revenues, gross
profit and net income.
Metal prices are volatile due to, among other things, fluctuations in foreign and domestic
production capacity, raw material availability, metals consumption and foreign currency rates. For
example, in the past few years, China has significantly increased its consumption of metals and
metal products. This large and growing demand for metals has significantly affected the metals
industry, diverting supply to China and contributing to the recent increase in metal prices. If, in
the future, China experiences a downturn in general economic conditions or increases its internal
production of metals, its demand for metals produced outside of China could decrease. Such a
decrease could cause a reduction in metal prices globally, which could adversely affect our
revenues, gross profit and net income. Additionally, significant currency fluctuations in the
United States or abroad could negatively impact our cost of metals and the pricing of our products.
Recently, the decline in the dollar relative to foreign currencies resulted in increased prices for
metals and metal products in the United States as imported metals became relatively more expensive.
If, in the future, the dollar increases in value relative to foreign currencies, the domestic
market may be more attractive to foreign producers, resulting in increased supply that could cause
decreased metal prices and adversely affect our revenues, gross profit and net income.
We operate in an industry that is subject to cyclical fluctuations and any downturn in general
economic conditions or our customers’ industries could negatively impact our revenues, gross profit
and net income.
The metals service center industry is cyclical, impacted by both market demand and metals
supply. Periods of economic slowdown or recession in the United States or other countries, or the
public perception that these may occur, could decrease the demand for our products and adversely
affect our pricing. For example, the general slowing of the economy in 2001, 2002 and 2003
adversely impacted our product sales and pricing. While we experienced significantly improved
pricing and healthy demand levels in 2004 and 2005, by comparison, this trend may not continue.
Changing economic conditions could depress or delay demand for our products, which could adversely
affect our revenues, gross profit and net income.
We sell many products to industries that are cyclical, such as the construction, semiconductor
and transportation industries, including aerospace. The demand for our products is directly related
to, and quickly impacted by, demand for the finished goods manufactured by our customers in these
industries, which may change as a result of the general U.S. or worldwide economy, domestic
exchange rates, energy prices or other factors beyond our control. If we are unable to accurately
project the product needs of our customers over varying lead times or if there is a limited
availability of products through allocation by the mills or otherwise, we may not have sufficient
inventory to be able to provide products desired by our customers on a timely basis. In addition,
if we are not able to increase sales of products to customers in other industries when one or more
of the cyclical industries that we serve is experiencing a decline, our revenues, gross profit and
net income may be adversely affected.
13
Table of Contents
We compete with a large number of companies in the metals service center industry, and, if we are
unable to compete effectively, our revenues, gross profit and net income may decline.
We compete with a large number of other general-line distributors and specialty distributors
in the metals service center industry. Competition is based principally on price, inventory
availability, timely delivery, customer service, quality and processing capabilities. Competition
in the various markets in which we participate comes from companies of various sizes, some of which
may have greater financial resources than we do and some of which could have more established brand
names in the local markets that we serve. Accordingly, these competitors may be better able to
withstand changes in conditions within our customers’ industries and may have greater operating and
financial flexibility than we have. To compete for customer sales, we may lower prices or offer
increased services at a higher cost, which could reduce our revenues, gross profit and net income.
If we were to lose any of our primary suppliers or otherwise be unable to obtain sufficient amounts
of necessary metals on a timely basis, we may not be able to meet our customers’ needs and may
suffer reduced sales.
We have few long-term contracts to purchase metals. Therefore, our primary suppliers of carbon
steel, alloy steel, stainless steel, aluminum or other metals could curtail or discontinue their
delivery of these metals to us in the quantities we need. Our ability to meet our customers’ needs
and provide value-added inventory management services depends on our ability to maintain an
uninterrupted supply of metal products from our suppliers. If our suppliers experience production
problems, lack of capacity or transportation disruptions, the lead times for receiving our supply
of metal products could be extended and the cost of our inventory may increase. If, in the future,
we are unable to obtain sufficient amounts of the necessary metals at competitive prices and on a
timely basis from our traditional suppliers, we may not be able to obtain these metals from
acceptable alternative sources at competitive prices to meet our delivery schedules. Even if we do
find acceptable alternative suppliers, the process of locating and securing these alternatives may
be disruptive to our business, which could have an adverse impact on our ability to meet our
customers’ needs and reduce our sales, gross profit and net income. In addition, if a significant
domestic supply source is discontinued and we cannot find acceptable domestic alternatives, we may
need to find a foreign source of supply. Dependence on foreign sources of supply could lead to
longer lead times, increased price volatility, less favorable payment terms and certain tariffs and
duties.
If we do not successfully implement our acquisition growth strategy, our ability to grow our
business could be impaired.
We may not be able to identify suitable acquisition candidates or successfully complete any
acquisitions or integrate any other businesses into our operations. If we cannot identify suitable
acquisition candidates, we are unlikely to sustain our historical growth rates, and, if we cannot
successfully integrate these businesses, we may incur increased or redundant expenses. Moreover,
any additional indebtedness we incur to pay for these acquisitions could adversely affect our
liquidity and financial strength.
As a decentralized business, we depend on both senior management and our key operating employees;
if we are unable to attract and retain these individuals, our ability to operate and grow our
business may be adversely affected.
Because of our decentralized operating style, we depend on the efforts of our senior
management, including our chief executive officer, David H. Hannah, our president and chief
operating officer, Gregg J. Mollins, and our executive vice president and chief financial officer,
Karla Lewis, as well as other key operating employees. We may not be able to retain these
individuals or attract and retain additional qualified personnel when needed. We do not have
employment agreements with any of our officers or employees, which may mean they may have less of
an incentive to stay with us when presented with alternative employment opportunities. In addition,
our senior management and key operating employees hold stock options that have vested and hold
common stock in our employee stock ownership plan. These individuals may, therefore, be more likely
to leave Reliance if the shares of our common stock significantly appreciate in value. The loss of
any key officer or employee will require remaining officers and employees to direct immediate and
substantial attention to seeking a replacement. Our inability to retain members of our senior
management or key operating employees or to find adequate replacements for any departing key
officer or employee on a timely basis could adversely affect our ability to operate and grow our
business.
We are subject to various environmental and employee safety and health regulations, which could
subject us to significant liabilities and compliance expenditures.
We are subject to certain federal, state and local environmental laws and regulations
concerning air emissions, wastewater discharges, underground storage tanks and solid and hazardous
waste disposal at or from our facilities. Our operations are also subject to various employee
safety and health laws and regulations, including those concerning occupational injury and illness,
employee exposure to hazardous materials and employee complaints. Environmental and employee safety
and health regulations are comprehensive, complex and frequently changing. Some of these laws and
regulations are subject to varying and conflicting interpretations.
14
Table of Contents
We may be subject from time to
time to administrative and/or judicial proceedings or investigations brought by private parties or
governmental agencies with respect to environmental matters and employee safety and health issues.
Currently, we have no material outstanding unresolved issues with environmental regulators.
Proceedings and investigations with respect to environmental matters and any employee safety and
health issues could result in substantial costs to us, divert our management’s attention and result
in significant liabilities, fines or the suspension or interruption of our service center
activities. Some of our current properties are located in industrial areas with histories of heavy
industrial use. The location of these properties may require us to incur expenditures and to
establish environmental liabilities for costs that arise from causes other than our operations.
Future events, such as changes in existing laws and regulations or their enforcement, new laws and
regulations or the discovery of conditions not currently known to us, could create material
compliance or remedial liabilities and costs which may constrain our operations or make such
operations more costly.
Our operating results have fluctuated, and are expected to continue fluctuating, depending on the
season, and such fluctuations may adversely affect our stock price.
Many of our customers are in seasonal businesses, including customers in the construction and
related industries. In addition, our revenues in the months of July, November and December
traditionally have been lower than in other months because of increased vacation days and holiday
closures for various customers. Consequently, you should not rely on our results of operations
during any particular quarter as an indication of our results for a full year or any other quarter.
In addition, if analysts and investors inaccurately estimate our results of operations in one or
more future quarters and our operating results fall below expectations, our stock price may
decline.
Ongoing tax audits may result in additional taxes.
Reliance and EMJ are undergoing various tax audits. These tax audits could result in
additional taxes, plus interest and penalties being assessed against either or both companies.
The acquisition of EMJ is our largest and first public company acquisition and there may be
additional risks of which we are not aware or existing risks may change over time.
The EMJ acquisition is our largest acquisition and our first acquisition of a public company.
There may be additional risks associated with this acquisition that we are not aware of at the
present time because we have not previously integrated a business of this size. After the
acquisition, customers may choose to diversify their metals suppliers to reduce their dependence on
a single supplier of the majority of their metals needs. We may not be able to retain all of the
Reliance and EMJ customers, and any loss of customers and the business that they bring to us could
have an adverse effect on our operating results.
We have agreed to assume liability for EMJ’s various retirement and pension plans. The actual
costs for the benefits to be provided to EMJ’s employees may exceed those projected, and further
actuarial assessments of the extent of those costs may exceed the current assessment. Any
adjustments that are required to be made to the recorded liability for these benefits could have an
adverse effect on our operating results and financial condition. In addition, we may be required
to make cash payments in excess or in addition to those that have been projected, which could have
an adverse effect on cash flow. We expect that we will record a significant amount of goodwill
related to our acquisition of EMJ. If EMJ does not perform as anticipated, this could result in an
impairment charge that could be material.
Our business could be adversely affected by economic downturns.
Demand for our products is affected by a number of general economic factors. A decline in
economic activity in the U.S. and other markets in which we operate could materially affect our
financial condition and results of operation.
Damage to our computer infrastructure and software systems could harm our business.
The unavailability of any of our information management systems for any significant period of
time could have an adverse effect on our operations. In particular, our ability to deliver products
to our customers when needed, collect our receivables and manage inventory levels successfully
largely depends on the efficient operation of our computer hardware and software systems. Through
information management systems, we provide inventory availability to our sales and operating
personnel, improve customer service through better order and product reference data and monitor
operating results. Difficulties associated with upgrades, installations of major software or
hardware, and integration with new systems could lead to business interruptions that could harm our
reputation, increase our operating costs and decrease our profitability. In addition, these systems
are vulnerable to, among other things, damage or interruption from power loss, computer system and
network failures, loss of telecommunications services, operator negligence, physical and electronic
loss of data, or security breaches and computer viruses.
15
Table of Contents
We have contracted with a third-party service provider that provides us with backup systems in
the event that our information management systems are damaged. It is possible that the backup
facilities and other protective measures we take could prove to be inadequate.
Principal shareholders who own a significant number of shares may have interests that conflict with
yours.
Florence Neilan, our largest shareholder, owns 12.7% of the outstanding shares of our common
stock and may have the ability to significantly influence matters requiring shareholder approval.
Upon successful completion of the EMJ merger, certain EMJ stockholders will own a significant
percentage of Reliance outstanding common stock. In deciding how to vote on such matters, these
shareholders may be influenced by interests that conflict with yours.
We have implemented anti-takeover provisions that may adversely impact your rights as a holder of
Reliance common stock.
Our articles of incorporation and our bylaws could delay, defer or prevent a third party from
acquiring us, despite the possible benefit to our shareholders, or otherwise adversely affect the
price of our common stock and the rights of our shareholders. We are authorized to issue 5,000,000
shares of preferred stock, no par value, with the rights, preferences, privileges and restrictions
of such stock to be determined by our board of directors, without a vote of the holders of common
stock. Our board of directors could grant rights to holders of preferred stock to reduce the
attractiveness of Reliance as a potential takeover target or make the removal of management more
difficult. In addition, our articles of incorporation and bylaws (1) impose advance notice
requirements for shareholder proposals and nominations of directors to be considered at shareholder
meetings and (2) establish a staggered or classified board of directors. These provisions may
discourage potential takeover attempts, discourage bids for our common stock at a premium over
market price or adversely affect the market price of, and the voting and other rights of the
holders of, our common stock. These provisions could also discourage proxy contests and make it
more difficult for you and other shareholders to elect directors other than the candidates
nominated by our board of directors. In addition, our credit facility and the provisions of our
senior notes contain limitations on our ability to enter into change of control transactions.
Item 1B. Unresolved Staff Comments
None.
Item 2. Properties.
We maintain more than 100 metals service center processing and distribution facilities in 32
states, and in Belgium, China and South Korea, and a sales office in France, plus our corporate
headquarters. All of our service center facilities are in good or excellent condition and are
adequate for our existing operations. These facilities generally operate at about 60% of capacity
based upon a 24-hour seven-day week, with each location averaging slightly less than two shifts
operating at full capacity for a five-day work week. Forty-three of these processing and
distribution facilities are leased. In addition, we lease our corporate headquarters in Los
Angeles, California. Siskin leases a portion of its facilities in Chattanooga, Tennessee, and
Liebovich leases a portion of its facilities in Rockford, Illinois. AMI Metals leases its
corporate office space in Brentwood, Tennessee. Chapel Steel leases its sales office in Chicago,
Illinois and its corporate office in Lower Gwynedd, Pennsylvania. Our international sales office
in France is also leased. The lease terms expire at various times through 2018 and the aggregate
monthly rent amount is approximately $1,050,000. We own all other properties.
In 2005 we began the expansion of our AMI Metals Europe SPRL warehouse in Belgium and our
Valex Korea facility in South Korea to meet our growing customer demand in Europe and Asia. We
expect to purchase land and build or expand facilities to increase current operating capacity and
efficiencies for other operations during 2006. In 2006, we are purchasing certain facilities that
were previously leased. The following table sets forth certain information with respect to each
facility. Any leased portions of owned facilities are not significant and are included in the
square footage information following.
16
Table of Contents
FACILITIES AND PLANT SIZE
| Location | Plant Size (Sq. ft.) | |||
Alabama: |
||||
Birmingham |
||||
(Chapel) |
98,000 | * | ||
(Chatham) |
110,000 | |||
(Phoenix Metals) |
40,000 | |||
(Siskin) |
107,000 | |||
Talladega (Precision) |
184,000 | |||
Arizona: |
||||
Phoenix |
||||
(Bralco Metals) |
46,000 | |||
(Reliance Metalcenter) |
104,000 | |||
(Tube Service) |
23,000 | |||
California: |
||||
El Cajon (Tube Service) |
18,000 | |||
Fontana (AMI) |
103,000 | |||
Fresno |
||||
(American Metals) |
125,000 | * | ||
(PDM) |
102,000 | |||
Hayward (Lusk Metals) |
47,000 | * | ||
La Mirada (Bralco Metals) |
140,000 | |||
Los Angeles |
||||
(Corporate Office) |
45,000 | * | ||
(Reliance Steel Company) |
270,000 | |||
Milpitas (Tube Service) |
58,000 | |||
National City (Reliance Metalcenter) |
74,000 | |||
Rancho Dominguez (CCC Steel) |
316,000 | |||
Redding (American Metals) |
42,000 | * | ||
Santa Clara (PDM) |
61,000 | |||
Santa Fe Springs |
||||
(MetalCenter) |
155,000 | |||
(Tube Service) |
66,000 | |||
Stockton (PDM) |
189,000 | |||
Union City (Reliance Metalcenter) |
145,000 | |||
Ventura (Valex) |
87,000 | |||
Vernon (United) |
34,000 | * | ||
West Sacramento (American Metals) |
108,000 | * | ||
Colorado: |
||||
Colorado Springs (Reliance Metalcenter) |
68,000 | |||
Denver |
||||
(Engbar) |
36,000 | |||
(Olympic) |
20,000 | * | ||
(Tube Service) |
21,000 | * | ||
Florida: |
||||
Orlando (Chatham) |
127,000 | |||
Tampa (Phoenix Metals) |
83,000 | |||
Georgia: |
||||
Atlanta (Georgia Steel) |
88,000 | |||
Norcross (Phoenix Metals) |
170,000 | |||
Savannah (Chatham) |
178,000 | |||
Idaho: |
||||
Boise (Pacific) |
40,000 | * | ||
Illinois: |
||||
Bourbonnais (Chapel) |
120,000 | * | ||
Franklin Park (Viking) |
91,000 | * | ||
Peoria (Hagerty) |
223,000 | |||
Rockford |
||||
(Liebovich) |
452,000 | |||
(Liebovich Custom Fabricating) |
30,000 | |||
Indiana: |
||||
Anderson (Precision) |
152,000 | |||
Rockport (Precision) |
55,000 | * | ||
Iowa: |
||||
Cedar Rapids (Liebovich/PDM) |
52,000 | |||
Kansas: |
||||
Kansas City (Central Plains) |
141,000 | |||
Wichita |
||||
(AMI) |
40,000 | * | ||
(Bralco Metals) |
45,000 | * | ||
(Central Plains) |
87,000 | |||
Kentucky: |
||||
17
Table of Contents
| Location | Plant Size (Sq. ft.) | |||
Bowling Green (Precision) |
256,000 | * | ||
Louisiana: |
||||
Lafayette (A&S) |
40,000 | * | ||
New Orleans (A&S) |
70,000 | * | ||
Maryland: |
||||
Baltimore (Durrett) |
250,000 | |||
Michigan: |
||||
Wyoming (Good Metals) |
65,000 | |||
Minnesota: |
||||
Minneapolis (Viking) |
122,000 | * | ||
Missouri: |
||||
St. Louis (AMI) |
46,000 | * | ||
Montana: |
||||
Billings (Pacific) |
12,000 | * | ||
Nevada: |
||||
Las Vegas (PDM) |
29,000 | * | ||
Sparks (PDM) |
44,000 | |||
New Hampshire: |
||||
Nashua (Valex) |
4,500 | * | ||
New Jersey: |
||||
Swedesboro (AMI) |
36,000 | * | ||
New Mexico: |
||||
Albuquerque |
||||
(Reliance Metalcenter) |
44,000 | |||
(Reliance Steel Company) |
34,000 | |||
North Carolina: |
||||
Charlotte (Phoenix Metals) |
41,000 | |||
Durham (Chatham) |
110,000 | |||
Greensboro (Steel Bar) |
43,000 | * | ||
Ohio: |
||||
Kenton (Precision) |
393,000 | |||
Massillon (SSA) |
27,000 | |||
Middletown (Precision) |
458,000 | |||
Minster (Precision) |
417,000 | |||
Monroe (Phoenix Metals) |
32,000 | * | ||
Tipp City (Precision) |
291,000 | |||
Oregon: |
||||
Eugene (Pacific) |
32,000 | |||
Medford (Pacific) |
5,000 | * | ||
Portland |
||||
(American Steel) |
270,000 | * | ||
(Chapel) |
52,000 | * | ||
(Pacific) |
111,000 | * | ||
(Reliance Metalcenter) |
44,000 | |||
(Tube Service) |
17,000 | * | ||
Pennsylvania: |
||||
Allentown (Valex) |
8,000 | * | ||
Chester Springs (Phoenix Metals) |
43,000 | * | ||
Indianola (Allegheny) |
53,000 | |||
Johnstown (Toma Metals) |
73,000 | |||
Pottstown (Chapel) |
122,000 | * | ||
South Carolina: |
||||
Columbia (Chatham) |
110,000 | |||
Spartanburg (Siskin) |
96,000 | |||
Tennessee: |
||||
Chattanooga (Siskin) |
415,000 | |||
Morristown (East Tennessee) |
33,000 | * | ||
Nashville (Siskin) |
117,000 | |||
Spring Hill (Phoenix Metals) |
66,000 | |||
Texas: |
||||
Arlington (Reliance Metalcenter) |
107,000 | |||
Austin (Valex) |
8,000 | * | ||
Fort Worth (AMI) |
75,000 | * | ||
Garland (Bralco Metals) |
45,000 | |||
Houston: |
||||
(Chapel) |
104,000 | * | ||
(Reliance Metalcenter) |
30,000 | |||
San Antonio (Reliance Metalcenter) |
77,000 | |||
Utah: |
||||
Salt Lake City |
||||
(Affiliated Metals) |
86,000 | |||
(CCC Steel) |
51,000 | |||
(Reliance Metalcenter) |
105,000 | |||
18
Table of Contents
| Location | Plant Size (Sq. ft.) | |||
Spanish Fork (PDM) |
42,000 | |||
Washington: |
||||
Auburn (AMI) |
27,000 | * | ||
Kent |
||||
(American Steel) |
168,000 | * | ||
(Bralco Metals) |
24,000 | * | ||
Spokane (Pacific) |
49,000 | |||
Tacoma (SSA) |
26,000 | * | ||
Tukwila (Pacific) |
76,000 | |||
Woodland (PDM) |
130,000 | |||
Wisconsin: |
||||
Kaukauna (Liebovich) |
35,000 | * | ||
International Sales and Distribution Centers |
||||
Gosselies, Belgium (AMI Europe) |
40,000 | |||
Lyon, France (AMI Europe) |
540 | * | ||
Suzhou, China (Everest) |
20,000 | * | ||
International Manufacturing Facility |
||||
Seoul, South Korea (Valex Korea) |
41,000 | |||
| * | Leased. All other facilities owned. |
Item 3. Legal Proceedings.
From time to time, we are named as a defendant in legal actions. Generally, these actions
arise out of our normal course of business. We are not a party to any pending legal proceedings
other than routine litigation incidental to the business. We expect that these matters will be
resolved without having a material adverse effect on our results of operations or financial
condition. We maintain liability insurance against risks arising out of our normal course of
business.
Item 4. Submission of Matters to a Vote of Security Holders.
No matters were submitted to a vote of security holders during the fourth quarter of the
fiscal year.
19
Table of Contents
PART II
Item 5. Market for Registrant’s Common Equity and Related Stockholder Matters.
Our common stock is listed on the New York Stock Exchange (“NYSE”) under the symbol “RS” and
was first traded on September 16, 1994. The following table sets forth the high and low reported
closing sale prices of the common stock on the NYSE Composite Tape for the stated calendar
quarters.
| 2005 | 2004 | |||||||||||||||
| High | Low | High | Low | |||||||||||||
First Quarter |
$ | 47.36 | $ | 36.29 | $ | 35.95 | $ | 27.39 | ||||||||
Second Quarter |
$ | 43.62 | $ | 35.04 | $ | 40.32 | $ | 31.96 | ||||||||
Third Quarter |
$ | 52.93 | $ | 37.52 | $ | 41.89 | $ | 36.33 | ||||||||
Fourth Quarter |
$ | 66.64 | $ | 49.15 | $ | 41.90 | $ | 33.72 | ||||||||
As of February 15, 2006, there were 247 record holders of our common stock.
We have paid quarterly cash dividends on our common stock for 46 years. In July 2005, the
regular quarterly dividend was increased 11% from $.09 to $.10 per share of common stock. Since
July 2004, our quarterly dividend has been increased 67%. Our Board of Directors has increased the
quarterly dividend rate on a periodic basis. The Board may reconsider or revise this policy from
time to time based on conditions then existing, including our earnings, cash flows, financial
condition and capital requirements, or other factors the Board may deem relevant. We expect to
continue to declare and pay dividends in the future, if earnings are available to pay dividends,
but we also intend to continue to retain a portion of earnings for reinvestment in our operations
and expansion of our business. We cannot assure you that either cash or stock dividends will be
paid in the future or that, if paid, the dividends will be at the same amount or frequency as paid
in the past.
The private placement debt agreements for our senior notes and our syndicated credit facility
contain covenants which, among other things, require us to maintain a minimum net worth and limit
cash dividends based upon our earnings, which may restrict our ability to pay dividends. Since our
initial public offering in September 1994 through 2005, we have paid between 5% and 25% of earnings
to our shareholders as dividends. In 2003, our dividend payments represented 22% of our earnings
due to the low earnings in 2003 as a result of the poor economic conditions. In 2005, our dividend
payments represented 6% of earnings.
The following table sets forth certain information with respect to our cash dividends declared
during the past two fiscal years:
| Date of Declaration | Record Date | Payment Date | Dividends | |||||||||
10/18/05 |
12/9/05 | 1/6/06 | $.10 per share | |||||||||
7/20/05 |
8/12/05 | 9/2/05 | $.10 per share | |||||||||
4/20/05 |
5/13/05 | 6/3/05 | $.09 per share | |||||||||
2/16/05 |
3/11/05 | 4/1/05 | $.09 per share | |||||||||
10/20/04 |
12/10/04 | 1/7/05 | $.07 per share | |||||||||
7/14/04 |
8/6/04 | 8/27/04 | $.07 per share | |||||||||
4/14/04 |
5/7/04 | 5/28/04 | $.06 per share | |||||||||
2/18/04 |
3/12/04 | 4/2/04 | $.06 per share | |||||||||
Although we have not offered any securities for sale in the last three years, we have
issued restricted stock on exercise of stock options granted pursuant to the Directors’ Stock
Option Plan, which was approved by shareholders. Proceeds from the exercise of these options were
used for working capital. Shares of our common stock were issued only to directors in the
following transactions exempt from registration under Sections 4(2) and 4(6) of the Securities Act:
| Number of Shares | Exercise Price | Date of Exercise | ||||||
7,500 |
$ | 17.11 | 5/15/05 | |||||
7,500 |
$ | 17.11 | 6/3/04 | |||||
15,000 |
$ | 18.83 | 3/11/04 | |||||
15,000 |
$ | 18.83 | 3/3/04 | |||||
9,000 |
$ | 18.83 | 1/29/04 | |||||
15,000 |
$ | 18.83 | 1/6/04 | |||||
7,500 |
$ | 18.58 | 1/6/04 | |||||
20
Table of Contents
Restricted shares of common stock were also issued under the Key-Man Incentive Plan,
which we have maintained since 1965. The recipients of the restricted stock are only restricted
from trading the shares for a period of two years from the date of the grant. There were no
proceeds received from the restricted stock granted under the Key-Man Incentive Plan. Shares of
our common stock were issued only to a limited number of key employees in the following
transactions exempt from registration under Sections 4(2) and 4(6) of the Securities Act:
| Number of Shares | Market Value | Date of Grant | ||||
5,582
|
$ | 44.00 | 2/21/05 | |||
7,295
|
$ | 32.29 | 3/1/04 | |||
21
Table of Contents
Item 6. Selected Financial Data.
We have derived the following selected summary consolidated financial and operating data for
the five years ended December 31, 2005 from our audited consolidated financial statements. You
should read the information below with our Consolidated Financial Statements, including the notes
related thereto, and Item 7. “Management’s Discussion and Analysis of Financial Condition and
Results of Operations.”
SELECTED CONSOLIDATED FINANCIAL DATA
| Year Ended December 31, | ||||||||||||||||||||
| 2005 | 2004 | 2003 | 2002 | 2001 | ||||||||||||||||
| (In thousands, except per share data) | ||||||||||||||||||||
Income Statement Data: (1) |
||||||||||||||||||||
Net sales |
$ | 3,367,051 | $ | 2,943,034 | $ | 1,882,933 | $ | 1,745,005 | $ | 1,656,974 | ||||||||||
Cost of sales |
2,449,000 | 2,110,848 | 1,372,310 | 1,268,251 | 1,194,512 | |||||||||||||||
Gross profit |
918,051 | 832,186 | 510,623 | 476,754 | 462,462 | |||||||||||||||
Operating expenses (2) |
550,411 | 525,306 | 430,493 | 406,479 | 371,006 | |||||||||||||||
Operating profit |
367,640 | 306,880 | 80,130 | 70,275 | 91,456 | |||||||||||||||
Other income (expense): |
||||||||||||||||||||
Interest expense |
(25,222 | ) | (28,690 | ) | (26,745 | ) | (22,605 | ) | (26,738 | ) | ||||||||||
Other income, net |
3,671 | 4,168 | 2,837 | 3,266 | 3,796 | |||||||||||||||
Amortization expense (3) |
(4,125 | ) | (3,208 | ) | (2,304 | ) | (1,355 | ) | (8,641 | ) | ||||||||||
Equity earnings of 50%-owned
company |
— | — | — | 263 | 286 | |||||||||||||||
Minority interest |
(8,752 | ) | (9,182 | ) | 938 | (124 | ) | — | ||||||||||||
Income before income taxes |
333,212 | 269,968 | 54,856 | 49,720 | 60,159 | |||||||||||||||
Provision for income taxes |
(127,775 | ) | (100,240 | ) | (20,846 | ) | (19,553 | ) | (23,823 | ) | ||||||||||
Net income |
$ | 205,437 | $ | 169,728 | $ | 34,010 | $ | 30,167 | $ | 36,336 | ||||||||||
Earnings per Share: |
||||||||||||||||||||
Income from continuing
operations — diluted |
$ | 6.21 | $ | 5.19 | $ | 1.07 | $ | .95 | $ | 1.28 | ||||||||||
Income from continuing
operations — basic |
$ | 6.24 | $ | 5.23 | $ | 1.07 | $ | .95 | $ | 1.28 | ||||||||||
Weighted average common shares
outstanding — diluted |
33,097 | 32,675 | 31,866 | 31,799 | 28,470 | |||||||||||||||
Weighted average common shares
outstanding — basic |
32,935 | 32,480 | 31,853 | 31,687 | 28,336 | |||||||||||||||
Other Data: |
||||||||||||||||||||
EBITDA (4) |
$ | 405,065 | $ | 343,285 | $ | 118,471 | $ | 100,871 | $ | 119,234 | ||||||||||
Cash flow from operations |
272,219 | 121,768 | 107,820 | 90,638 | 104,038 | |||||||||||||||
Capital expenditures |
53,740 | 35,982 | 20,909 | 18,658 | 24,539 | |||||||||||||||
Cash dividends per share |
.38 | .26 | .24 | .24 | .24 | |||||||||||||||
Balance Sheet Data (December 31): |
||||||||||||||||||||
Working capital |
$ | 513,529 | $ | 458,551 | $ | 341,762 | $ | 390,201 | $ | 379,669 | ||||||||||
Total assets |
1,769,070 | 1,563,331 | 1,369,424 | 1,139,758 | 1,082,502 | |||||||||||||||
Long-term debt (5) |
306,790 | 380,850 | 469,250 | 344,080 | 331,975 | |||||||||||||||
Shareholders’ equity |
1,029,865 | 822,552 | 647,619 | 610,435 | 583,561 | |||||||||||||||
| (1) | Does not include financial results of American Steel, L.L.C. for the year ended December 31, 2001 and the period January 1, 2002 to April 30, 2002 because we accounted for our 50% investment by the equity method, and therefore we excluded 50% of American Steel’s earnings in our net income and earnings per share amounts. Effective May 1, 2002 we began consolidating American Steel’s financial results due to an amendment to the Operating Agreement, which gave us 50.5% of the ownership units and eliminated all super-majority and unanimous voting rights, among other changes. The portion of American Steel’s earnings attributable to our 49.5% partner is included in minority interest. | |
| (2) | Operating expenses include warehouse, delivery, selling, general and administrative expenses and depreciation expense. | |
| (3) | Amortization expense included the amortization expense related to goodwill in the year ended December 31, 2001. | |
| (4) | EBITDA is defined as the sum of income before interest expense, income taxes, depreciation expense and amortization of intangibles (including goodwill). We believe that EBITDA is commonly used as a measure of performance for companies in our industry and is frequently used by analysts, investors, lenders and other interested parties to evaluate a company’s financial performance and its ability to incur and service debt while providing useful information. EBITDA should not be considered in isolation or as a substitute for consolidated statements of income and cash flows data prepared in accordance with accounting principles generally accepted in the United States and should not be construed as an indication of a company’s operating performance or as a measure of liquidity. EBITDA as measured in this |
22
Table of Contents
| Annual Report on Form 10-K is not necessarily comparable with similarly titled measures for other companies. |
| 2005 | 2004 | 2003 | 2002 | 2001 | ||||||||||||||||
Reconciliation of EBIT and EBITDA: |
||||||||||||||||||||
Income before provision for income
taxes |
$ | 333,212 | $ | 269,968 | $ | 54,856 | $ | 49,720 | $ | 60,159 | ||||||||||
Interest expense |
25,222 | 28,690 | 26,745 | 22,605 | 26,738 | |||||||||||||||
EBIT |
358,434 | 298,658 | 81,601 | 72,325 | 86,897 | |||||||||||||||
Depreciation expense |
42,506 | 41,419 | 34,566 | 27,191 | 23,696 | |||||||||||||||
Amortization expense |
4,125 | 3,208 | 2,304 | 1,355 | 8,641 | |||||||||||||||
EBITDA |
$ | 405,065 | $ | 343,285 | $ | 118,471 | $ | 100,871 | $ | 119,234 | ||||||||||
| (5) | Includes the long-term portion of capital lease obligations as of December 31, 2005. We did not have any capital lease obligations for any other years presented. |
23
Table of Contents
Item 7. Management’s Discussion and Analysis of Financial Condition and Results of Operations.
MANAGEMENT’S DISCUSSION AND ANALYSIS OF
FINANCIAL CONDITION AND RESULTS OF OPERATIONS
FINANCIAL CONDITION AND RESULTS OF OPERATIONS
Overview
In 2005, we generated higher revenues, profits and cash flows than our company has ever
experienced. We had not expected to beat our 2004 results, as the 2004 year was unlike any other
that we had seen for the metals service center industry, with most metals service center companies
generating record financial results in 2004. In 2004, we experienced unprecedented high prices
that increased rapidly for most carbon steel products, with improved demand from our customers.
However, our 2005 results were even stronger than our 2004 results due to our diverse product mix,
along with healthy pricing and improved demand for most products that we sell, especially for
products sold to the aerospace market.
Demand for most of our products improved in 2005 from 2004 levels, especially in the second
half of 2005. Demand for aerospace products increased significantly throughout 2005 and demand for
non-residential construction products improved substantially in the second half of 2005. We expect
demand for most products to remain strong in 2006.
Pricing for carbon steel products increased significantly and rapidly in 2004. This resulted
mainly from supply limitations due to shortages of raw materials at the mill level because of
increased global demand for these raw materials, due to lower domestic capacity as some mill
capacity was shut down during 2002 and 2003, and due to reduced quantities of import material
entering the United States because of higher pricing levels in other parts of the world, especially
China. In 2005, carbon steel costs declined during the first eight months of the year, then
increased in the fourth quarter of 2005. We believe the pricing pressure in the beginning of the
year was related to a surplus of metal in the supply chain. However, costs for carbon steel
products remain at high levels compared to historical levels, and the average cost for the 2005
year was higher than for the 2004 year. Aluminum and stainless steel costs increased consistently
during most of 2004 due to improved demand and some supply limitations, and continued to increase
somewhat in 2005. Aluminum, stainless steel and titanium products used by the aerospace industry
are in tight supply and prices for these products increased significantly and rapidly throughout
2005.
Because of the overall healthy demand in 2005, we were typically able to increase our selling
prices for most products at a rate equal to or above our cost increases. However, pressures on
carbon steel costs and pricing during the first eight months of the year resulted in reduced gross
profit margins for these products during that time. The strong demand and tight supply of
aerospace products allowed us to increase our selling prices for these products prior to receiving
the higher cost metal into our inventory increasing our gross profit margins. Our 2005 gross
profit margins were very healthy.
We are proud of our record 2005 financial results that highlighted the importance of our
product diversity and the efforts of our managers. In addition to profitability, we focus on
working capital management which allows us to generate cash flow to further expand and strengthen
our business and reduce debt during most environments. Our 2005 cash flow from operations was our
highest ever, reflecting the quality of our earnings. We completed one acquisition in 2005, grew
our existing operations, and continued to evaluate opportunities that would allow us to improve our
profitability. In January 2006, we reached an agreement to acquire Earle M. Jorgensen Company, our
largest acquisition to-date and our first public-company acquisition, which we expect to complete
during the 2006 second quarter, pending approval of the EMJ stockholders. We also identified
opportunities to expand our existing operations and took actions to allow for this profitable
future growth.
We believe the steps that we took during the difficult years of 2001 through 2003 positioned
us to take full advantage of the improved economic conditions we experienced in 2004 and 2005.
However, as evidenced by our performance during the difficult years, we take the necessary actions
to allow us to operate efficiently and profitably even in less favorable economies. We believe
this is because of our focus on cost controls and inventory turnover and our product, customer and
geographic diversification. Our product and geographic diversification should continue to benefit
us in 2006. We are optimistic about business conditions in 2006. Significant declines in demand
or pricing for our products, although not expected, could reduce our gross profit margins. Also,
if we cannot obtain a sufficient supply of metals for our customers in 2006, or if domestic
availability of our products increases significantly in 2006, this could negatively impact our 2006
financial results, especially as compared to our 2005 results.
Customer demand can have a significant impact on our results of operations. When volume
increases, our revenue dollars increase, which contributes to increased gross profit dollars.
Variable costs may also increase with volume including increases in our warehouse, delivery,
selling, general and administrative expenses. Conversely, when volume declines, we typically
produce fewer revenue dollars which can reduce our gross profit dollars. We can reduce certain
variable expenses when volumes decline, but we cannot easily reduce our fixed costs.
24
Table of Contents
Pricing for our products can have a more significant impact on our results of operations than
customer demand levels. As pricing increases, so do our revenue dollars. Our pricing usually
increases when the cost of our materials increases. If prices increase and we maintain the same
gross profit percentage, we generate higher levels of gross profit and pre-tax income dollars.
Conversely, if pricing declines, we will typically generate lower levels of gross profit and
pre-tax income dollars. Because changes in pricing do not require us to adjust our expense
structure, the impact on our results of operations is much greater than the effect of volume
changes.
Also, when volume or pricing increases, our working capital requirements typically increase,
which may require us to increase our outstanding debt. This could increase our interest expense.
When our customer demand falls, we can typically generate strong levels of cash flow from
operations as our working capital needs decrease.
Recent Developments
In 2005 we completed one acquisition and formed a joint venture company to allow us to expand
into China. In the first quarter of 2006, we have acquired the remaining interest in our
50.5%-owned company, reached an agreement for our largest acquisition to-date, announced an
agreement to purchase the assets and business of a toll processing company, and acquired our first
company in China through the joint venture company we formed in 2005. We also opened facilities in
new geographic areas, expanded existing facilities and purchased certain facilities that we
previously leased.
On July 1, 2005, we acquired 100% of the outstanding capital stock of Chapel Steel Corp.,
headquartered in Spring House (Philadelphia), Pennsylvania. We paid approximately $94.2 million in
cash for the equity of Chapel Steel and assumed approximately $16.8 million of Chapel Steel’s debt.
Chapel Steel was a privately held metals service center company founded in 1972 that processes and
distributes carbon and alloy steel plate products from five facilities in Pottstown (Philadelphia),
Pennsylvania; Bourbonnais (Chicago), Illinois; Houston, Texas; Birmingham, Alabama; and Portland,
Oregon. Chapel Steel also warehouses and distributes its products in Cincinnati, Ohio and Hamilton,
Ontario, Canada. Chapel Steel’s net sales for the six months ended December 31, 2005 were
approximately $131 million. Chapel Steel now operates as a wholly-owned subsidiary of Reliance.
On January 3, 2006, we acquired the remaining 49.5% of our subsidiary, American Steel, L.L.C.,
that we did not already own. American Steel operates metals service centers in Portland, Oregon
and Kent, Washington and had 2005 net sales of approximately $107 million.
On January 17, 2006, we entered into an agreement to acquire Earle M. Jorgensen Company
(“EMJ”), a publicly-held metals service center company with forty locations in the U.S. and Canada
and fiscal year ended March 31, 2005 net sales of approximately $1.6 billion. If approved by EMJ’s
stockholders, we will acquire EMJ for approximately $13.00 per EMJ
share, to be paid approximately
50% in cash and 50% in Reliance stock, subject to the established minimum and maximum amount of
stock to be issued. We expect to close this transaction in April 2006, if approved by the EMJ
stockholders.
On February 28, 2006, we announced that we have reached an agreement to purchase the assets
and business of Flat Rock Metal Processing, L.L.C. Flat Rock is a privately-held, toll processing
company. Our subsidiary, Precision Strip, will operate the Flat Rock facilities in Perrysburg,
Ohio and Eldridge, Iowa. This transaction is expected to be completed
in the 2006 second quarter.
On March 1, 2006, we acquired Everest Metals (Suzhou) Co., Ltd., a metals service center
company based near Shanghai, China, through our 70%-owned joint venture company Reliance Pan
Pacific Pte., Ltd., that we formed in October of 2005. Everest Metals was previously wholly-owned
by our joint venture partner. Everest Metals processes and distributes primarily aluminum products
to the electronics industry in China, with 2005 net sales of approximately $5.5 million.
We also entered into a $600 million, five-year, unsecured revolving credit facility in June of
2005 that replaced our previous $335 million revolving credit facility. This increased capacity
will allow us to continue to grow our business. If the EMJ acquisition closes, our current $600
million credit facility will be increased to $700 million, to support the needs of our combined
company.
25
Table of Contents
Results of Operations
The following table sets forth certain income statement data for each of the three years in
the period ended December 31, 2005 (dollars are shown in thousands and certain amounts may not
calculate due to rounding):
| 2005 | 2004 | 2003 | ||||||||||||||||||||||
| % of | % of | % of | ||||||||||||||||||||||
| $ | Net Sales | $ | Net Sales | $ | Net Sales | |||||||||||||||||||
Net sales |
$ | 3,367,051 | 100.0 | % | $ | 2,943,034 | 100.0 | % | $ | 1,882,933 | 100.0 | % | ||||||||||||
Gross profit |
918,051 | 27.3 | 832,186 | 28.3 | 510,623 | 27.1 | ||||||||||||||||||
S,G&A expenses |
507,905 | 15.1 | 483,887 | 16.4 | 395,927 | 21.0 | ||||||||||||||||||
Depreciation expense |
42,506 | 1.3 | 41,419 | 1.4 | 34,566 | 1.8 | ||||||||||||||||||
Operating profit (1) |
$ | 367,640 | 10.9 | % | $ | 306,880 | 10.4 | % | $ | 80,130 | 4.3 | % | ||||||||||||
| (1) | Excludes other income, amortization expense, minority interest, interest expense and income tax expense. |
Year Ended December 31, 2005 Compared to Year Ended December 31, 2004
Net Sales. Our 2005 consolidated net sales were a record $3.37 billion, an increase of 14.4%,
compared to $2.94 billion in 2004. This increase includes the additional sales from Chapel Steel
of $130.7 million that we acquired in July 2005. Our increased sales include an increase in our
tons sold of 1.8% and an increase in our average selling price per ton sold of 12.5% (the tons sold
and average selling price per ton sold exclude amounts related to Precision Strip). Same-store
sales, which exclude the sales of Chapel Steel, were $3.24 billion in 2005, up 10% from 2004, with
a 3.9% decrease in our tons sold and a 14.4% increase in our average selling price per ton sold.
Our 2005 volume increased due to the additional sales of Chapel Steel, however, on a
same-store basis, our 2005 volume is down from 2004 mainly because of the heavy buying that
occurred in 2004 when our customers were trying to build inventory ahead of the significant carbon
steel price increases. Because carbon steel prices were declining for most of 2005, our customers
were not building inventory until late in the 2005 third quarter. We experienced demand
improvement beginning late in the 2005 third quarter that continued throughout the fourth quarter.
This was due to improved end markets for most products we sell, with non-residential construction
and aerospace being significant contributors to the strong end market demand.
Our average selling price per ton sold has been higher in 2005 than in 2004 mainly because of
increased costs for most products that we sell and due to a small shift in product mix to a higher
percentage of aluminum and stainless steel products as compared to 2004. Although carbon steel
costs declined during the first eight months of 2005, the 2005 average cost for the full year
remained above the 2004 average. Aluminum and stainless steel costs began increasing in 2004 and
continued to increase throughout 2005, with significant and rapid increases in the costs of
aerospace products. The improved demand for aerospace products resulted in a slight shift in
product mix to higher-priced products that contributed to our increased average selling prices in
2005.
Gross Profit. Our total gross profit of $918.1 million, up 10.3% from 2004, increased mainly
because of our higher net sales amount in 2005. Our gross profit as a percentage of sales was
27.3% in 2005, down from 28.3% in 2004. In 2005 our gross profit margins declined mainly because
of the pressure on our selling prices for carbon steel products resulting from lower costs,
especially compared to 2004 when we experienced high profitability levels for these products
because of limited availability and significant cost increases. Gross profit margins for aerospace
related products were higher in 2005 because we were able to increase our selling prices ahead of
our costs. The acquisition of Chapel Steel lowered our gross profit margin somewhat, as their
business is more of a wholesale distribution business that operates at a lower gross profit margin
than our consolidated average. Our 2005 same-store gross profit margin was 27.7%. Also, our 2005
LIFO expense was significantly lower than in 2004 primarily due to decreases in carbon steel costs,
with the impact somewhat offset by the rising costs of aerospace products. We recorded LIFO
expense, which is included in our cost of sales, of $16.6 million during 2005, compared to $110.8
million in 2004. Most of our 2005 LIFO expense was due to increased costs for aerospace related
aluminum, titanium, and stainless steel products.
26
Table of Contents
Expenses. Warehouse, delivery, selling, general and administrative expenses (“S,G&A
expenses”) for 2005 increased $24.0 million, or 5.0% from 2004. The expenses as a percent of sales
in 2005 were 15.1% compared to 16.4% in the 2004 period. The dollar increase in S,G&A expenses was
mostly due to the inclusion of Chapel Steel beginning in the third quarter, as well as general cost
increases. The decrease in our S,G&A expenses as a percentage of sales was due mainly to our
increased sales levels and because Chapel Steel’s S,G&A expenses are lower than the Company’s
average as a percentage of sales.
Depreciation expense increased $1.1 million in 2005 because of the additional expense from
Chapel Steel and expense on our 2005 fixed asset additions. Amortization expense increased $0.9
million in 2005 primarily due to the write off of financing costs related to our $335 million
syndicated credit facility that we replaced in June of 2005 and because of the amortization expense
from Chapel Steel.
Operating Profit. Operating profit, calculated as gross profit less S,G&A expenses and
depreciation expense, was $367.6 million in 2005, resulting in an operating profit margin of 10.9%,
compared to 2004 operating profit of $306.9 million and an operating profit margin of 10.4%. The
improvement resulted from our higher sales levels that provided increased operating profit dollars
in 2005, along with our healthy gross profit margins and lower S,G&A expenses as a percentage of
sales, as discussed above.
Other Income and Expense. Interest expense was $25.2 million in 2005 compared to $28.7
million in 2004. The decrease was mainly due to lower borrowing levels because of the increased
cash flow from operations that we generated in 2005. Our 2005 interest expense includes interest
on our borrowings of approximately $111 million to fund the acquisition of Chapel Steel on July 1,
2005, which we had fully repaid as of December 31, 2005.
Minority interest expense decreased in 2005 compared to 2004 mainly because we purchased the
remaining 30.5% interest in Valex Korea from our partner in July 2004. The 2005 minority interest
expense represents the net income attributed to the 49.5% of American Steel, L.L.C that we did not
own. As further discussed in the Liquidity and Capital Resources section, we purchased the
remaining 49.5% interest in American Steel in January 2006.
Income Tax Rate. Our effective income tax rate was 38.3% in 2005, up from 37.1% in 2004,
mainly due to an increase in our state rate because of shifts in the geographic composition of our
2005 income, resulting mainly from our acquisition of Chapel Steel and the increased profitability
from our locations that serve the aerospace market.
Year Ended December 31, 2004 Compared to Year Ended December 31, 2003
Net Sales. Our 2004 consolidated net sales were $2.94 billion, an increase of 56.3%, compared
to $1.88 billion in 2003. This increase includes the additional sales from Precision Strip that we
acquired in July 2003. Our increased sales include an increase in our tons sold of 4.3% and an
increase in the average selling price per ton sold of 47.6%. The increase in our tons sold was
mainly due to somewhat improved customer demand in all markets in 2004 as compared to 2003 levels.
We began to experience higher sales volumes in September 2003 that continued through the first nine
months of 2004. This included a peak in the March 2004 period, which we believe was due in part to
increased buying by our customers to beat announced mill price increases. In the fourth quarter of
2004, we experienced a slight slowdown from earlier in the year, which we believe was mainly due to
the typical seasonal slowdown during this period.
The increase in our average selling price per ton sold of 47.6% resulted mainly from
significant increases in our costs of carbon steel products along with limited supply during most
of 2004. Carbon steel costs increased significantly in the first nine months of 2004, with the
most rapid and pronounced increases in the first half of the year. Supply was limited due to raw
material shortages at the mill level resulting from increased global demand, especially China, and
reduced domestic capacity. This resulted in increased costs from the mills and an environment that
allowed us to pass through our increased costs to our customers. In some cases, we were able to
pass through the significant cost increases before we received the higher cost metal in our
inventory. We did experience some softening of carbon steel prices in the fourth quarter of 2004.
Our prices for aluminum and stainless steel products increased consistently during most of 2004 due
to reduced supply and improved customer demand, especially for aerospace products.
Gross Profit. Our total gross profit of $832.2 million increased 63.0% from 2003 mainly
because of the increased pricing levels of our products in 2004. Our gross profit as a percentage
of sales was 28.3% in 2004, up from 27.1% in 2003. The improvement in our gross profit percentage
resulted from the improved business conditions discussed above that allowed us to pass through our
cost increases to our customers, especially in the first half of 2004 when we were able to increase
our selling prices before we received the higher cost metal in our inventory. Due to the increased
cost of our metals, our 2004 cost of sales includes $110.8 million of LIFO expense, compared to
$0.9 million of LIFO expense in 2003. LIFO expense reduces our gross profit.
27
Table of Contents
Expenses. S,G&A expenses for 2004 increased $88.0 million, or 22.2% from 2003. This increase
includes a full year of S,G&A expenses of Precision Strip, along with increased expenses to support
our higher sales levels, including higher incentives and bonuses due to the record profit levels
achieved at many of our operations. Our S,G&A expenses represented 16.4% of sales in 2004, down
from 21.0% in 2003. The improvement as a percentage of sales was mainly because of the significant
increases in our average selling price per ton sold, which did not require us to change our expense
structure.
Depreciation expense increased $6.9 million in 2004 over 2003 mainly because of the additional
expense related to Precision Strip.
Operating Profit. Operating profit was $306.9 million in 2004, resulting in an operating
profit margin of 10.4%, compared to 2003 operating profit of $80.1 million and an operating profit
margin of 4.3%. The significant improvement occurred because of the improved business conditions,
especially the favorable pricing, discussed above.
Other Income and Expense. Interest expense was $28.7 million in 2004 compared to $26.7
million in 2003. The increase was mainly due to increased borrowing levels to fund our increased
working capital needs in 2004 and to fund the acquisition of Precision Strip on July 1, 2003.
Although variable interest rates increased in 2004, we were able to offset the effect of this as
the pricing on our borrowings declined due to our improved profitability.
Minority interest expense increased in 2004 compared to 2003 mainly due to the improved
operating performance at our 50.5%-owned company, American Steel, that sells primarily carbon steel
plate products. Minority interest also includes expense related to Valex Korea during the first
seven months of 2004 that was attributable to our 30.5% partner. In July 2004 we purchased the
remaining interest in Valex Korea from our partner. Valex Korea’s performance benefited from a
strong Asian market for semiconductor products in 2004.
Income Tax Rate. Our effective income tax rate was 37.1% in 2004, down from 38.0% in 2003,
mainly due to shifts in the geographic composition of our 2004 income, lower income tax rates from
our foreign operations that were profitable in 2004 and benefits from state and city income tax
credits.
Liquidity and Capital Resources
At December 31, 2005, our working capital was $513.5 million, up from $458.6 million at
December 31, 2004. The overall increase was primarily from the additional working capital of
Chapel Steel. Excluding the acquired balances of Chapel Steel, our accounts receivable increased
$15.4 million and our inventory increased $11.3 million to support our improved sales levels. These
amounts were offset by an increase in our accounts payable and accrued expenses of $38.3 million
mainly from our increased costs of inventory.
To manage our working capital, we focus on our days sales outstanding to monitor accounts
receivable and on our inventory turnover rate to monitor our inventory levels, as receivables and
inventory are our two most significant elements of working capital. Although the amount of our
accounts receivable increased in 2005, our accounts receivable days sales outstanding rate at
December 31, 2005 was 40 days, improved from our December 31, 2004 rate of 41 days. (We calculate
our days sales outstanding as an average of the most recent two-month period.) Our inventory
turnover rate improved to about 5.7 times in 2005 from about 5.1 times in 2004 due to improved
demand and effective inventory management. As demand and pricing for our products increase or
decrease, our working capital needs increase or decrease, respectively. We expect to finance
increases in our working capital needs through operating cash flow or with borrowings on our
syndicated credit facility.
Our primary sources of liquidity are generally from internally generated funds from operations
and our revolving line of credit. Cash flow provided by operations was $272.2 million in 2005
compared to $121.8 million in 2004. Our strong cash flow resulted from our high profit levels and
our continued effective working capital management. We used this cash flow to acquire Chapel
Steel, to pay down debt of approximately $93.5 million, and to fund our capital expenditures of
approximately $53.7 million in 2005.
To fund the purchase of Chapel Steel and the repayment of its outstanding debt, we borrowed
$111 million on our line of credit on July 1, 2005. As of December 31, 2005, all the borrowings on
our line of credit were fully repaid from our cash flow from operations. We had $15.2 million of
letters of credit outstanding under our $600 million credit facility, with availability to issue an
additional $34.8 million of letters of credit at December 31, 2005. In 2005 we paid down $46
million of private placement notes upon their maturity with cash flow from operations. Our net
debt-to-total capital ratio at December 31, 2005 was 23.8%, down from 33.6% at December 31, 2004.
On January 3, 2006, we paid off a $25 million private placement note upon its maturity and
purchased the remaining 49.5% of American Steel for $12 million with borrowings on our credit
facility.
28
Table of Contents
In June 2005, we replaced our $335 million credit facility with a $600 million, five-year,
unsecured revolving credit facility with fifteen banks. The $335 million facility was scheduled to
mature in October 2006. We wanted to take advantage of the favorable bank market, which allowed us
to obtain more favorable pricing on our borrowings, along with providing greater flexibility. We
initially approached the market to raise $400 million, but because of the favorable response, we
increased the commitment to $600 million to support the growth of our business over the next five
years.
We also have $347 million of outstanding senior unsecured notes issued in private placements
of debt. The outstanding senior notes bear interest at an average fixed rate of 6.17% and have an
average remaining life of 4.2 years, maturing from 2006 to 2013. In 2006, $49 million of these
notes will mature. Our $600 million syndicated credit facility and our senior notes require that
we maintain a minimum net worth and interest coverage ratio, and a maximum leverage ratio and
includes restrictions on the amount of cash dividends we may pay.
Both the $335 million syndicated credit agreement that was replaced in June 2005 and the
senior notes became secured on July 1, 2003 concurrent with our acquisition of Precision Strip. The
personal property pledged as collateral included, but was not limited to, the outstanding
securities of each of our material corporate subsidiaries. The security interest terminated when we
met certain conditions, including a required leverage ratio. In the first quarter of 2005 the
security interest granted under our syndicated credit facility and our senior note agreements was
automatically released as we met the required conditions of the release. The senior note agreements
and our new $600 million credit facility are unsecured.
Upon our acquisition of Chapel Steel, we assumed noncancelable capital leases related to three
buildings with terms expiring at various years through 2018. At December 31, 2005, total
obligations under these capital leases were $6.1 million. All three leases were with related
parties of Chapel Steel.
Capital expenditures, excluding acquisitions, were $53.7 million for the 2005 year. Our 2006
capital expenditures are currently budgeted at approximately $91 million, excluding acquisitions.
Our 2006 budget includes several growth initiatives to expand or relocate existing facilities and
to purchase certain facilities that are currently leased. Any capital expenditure commitments that
existed at December 31, 2005 are included in the below table of contractual obligations. Our
capital and operating lease commitments are discussed in Note 11 of the Notes to Consolidated
Financial Statements and are also included in the contractual obligations table below. Our capital
requirements are primarily for working capital, acquisitions, and capital expenditures for
continued improvements in plant capacities and materials handling and processing equipment.
If the pending merger with EMJ is completed, we will be required to make cash payments of
approximately $385 million and issue Reliance common stock valued at approximately $339 million.
The estimated purchase price of the acquisition is based upon a price of about $13.00 per share of
EMJ common stock, payable approximately half in cash and half in Reliance common stock. Each EMJ
shareholder will receive $6.50 in cash and a fraction of a Reliance share for each share of EMJ
common stock. The cash portion, which includes the cash out of certain EMJ options and estimated
transaction costs, will be financed under our $600 million syndicated credit facility.
Additionally, we will assume approximately $286 million of EMJ’s existing long-term debt, adjusted
by any payments or borrowings made by EMJ prior to the closing of the acquisition. In February
2006, we obtained the consent of our bank group to complete the EMJ acquisition and obtained
amendments to both our syndicated credit facility and our private placement notes to allow for
EMJ’s senior secured indentures of $250 million. In addition, upon closing of the EMJ acquisition,
our syndicated credit facility will be increased to $700 million from $600 million.
We anticipate that funds generated from operations and funds available under our line of
credit will be sufficient to meet our working capital, capital expenditure and senior debt
repayment needs for the foreseeable future. We also anticipate that we will be able to fund
acquisitions with borrowings under our line of credit, including the EMJ acquisition.
29
Table of Contents
The following table summarizes our contractual cash obligations as of December 31, 2005.
Certain of these contractual obligations are reflected on our balance sheet, while others are
disclosed as future obligations under accounting principles generally accepted in the United
States.
| Payments due by Year | ||||||||||||||||||||
| (in thousands) | ||||||||||||||||||||
| Less than | More than | |||||||||||||||||||
| Contractual Obligations | Total | 1 year | 1-3 years | 3-5 years | 5 years | |||||||||||||||
Long Term Debt Obligations(1) |
$ | 350,800 | $ | 49,525 | $ | 76,175 | $ | 88,950 | $ | 136,150 | ||||||||||
Capital Lease Obligations |
7,337 | 780 | 1,560 | 1,560 | 3,437 | |||||||||||||||
Operating Lease Obligations |
63,372 | 17,112 | 26,942 | 12,547 | 6,771 | |||||||||||||||
Purchase Obligations –Other (2) |
49,687 | 46,513 | 2,068 | 272 | 834 | |||||||||||||||
Other Long-Term Liabilities |
||||||||||||||||||||
Reflected on the Balance Sheet
under GAAP (3) |
20,153 | 1,816 | 3,874 | 4,649 | 9,814 | |||||||||||||||
Total |
$ | 491,349 | $ | 115,746 | $ | 110,619 | $ | 107,978 | $ | 157,006 | ||||||||||
| (1) | Amounts include principal payments only. See Note 6 of the Consolidated Financial Statements for information regarding interest rates and payment dates. | |
| (2) | Includes capital expenditure items committed to as of December 31, 2005, including three lease buy-out options at fair market value estimated at $25 million. Includes non-cancelable purchase or service contracts with a term of one year or greater that existed at December 31, 2005. The majority of our material purchases are completed within 30 to 120 days and therefore are not included in this table. Also includes the amount of the put option to purchase the remaining 49.5% interest in American Steel, L.L.C., for $12 million per the terms of the Operating Agreement. This purchase was completed on January 3, 2006. | |
| (3) | Includes the estimated benefit payments or contribution amounts for the Company’s defined benefit pension plans and SERP plans for the next ten years. These amounts are limited to the information provided by our actuaries. |
Contractual obligations for purchases of goods or services are defined as agreements that
are enforceable and legally binding on our Company and that specify all significant terms,
including fixed or minimum quantities to be purchased; fixed, minimum or variable price provisions;
and the approximate timing of the transaction. Our purchase orders are based on our current needs
and are typically fulfilled by our vendors within short time horizons. In addition, some of our
purchase orders represent authorizations to purchase rather than binding agreements. We do not
have significant agreements for the purchase of goods specifying minimum quantities and set prices
that exceed our expected requirements for three months. Therefore, agreements for the purchase of
goods and services are not included in the table above.
The expected timing of payments of the obligations above is estimated based on current
information. Timing of payments and actual amounts paid may be different, depending on the time of
receipt of goods or services, or changes to agreed-upon amounts for some obligations.
In May 2005, our Board of Directors amended and restated our stock repurchase program
authorizing up to an additional six million shares of our common stock to be repurchased.
Repurchased shares are redeemed and treated as authorized but unissued shares. As of December 31,
2005, and prior to the additional authorization in May 2005, we had repurchased a total of 5.5
million shares of our common stock under this plan, at an average cost of $14.94 per share. We did
not repurchase any shares of our common stock during 2005, 2004 or 2003. We believe such
purchases, given appropriate circumstances, enhance shareholder value and reflect our confidence in
the long-term growth potential of our company. Proceeds from the issuance of common stock upon the
exercise of stock options during 2005 were $10.8 million.
Inflation
Our operations have not been, and we do not expect them to be, materially affected by general
inflation. Historically, we have been successful in adjusting prices to our customers to reflect
changes in metal prices.
30
Table of Contents
Seasonality
Some of our customers may be in seasonal businesses, especially customers in the construction
industry. As a result of our geographic, product and customer diversity, however, our operations
have not shown any material seasonal trends. Revenues in the months of July, November and December
traditionally have been lower than in other months because of a reduced number of working days for
shipments of our products, because of vacation and holiday closures at some of our customers. We
cannot assure you that period-to-period fluctuations will not occur in the future. Results of any
one or more quarters are therefore not necessarily indicative of annual results.
Goodwill
Goodwill, which represents the excess of cost over the fair value of net assets acquired,
amounted to $384.7 million at December 31, 2005, or approximately 21.7% of total assets or 37.4% of
consolidated shareholders’ equity. Under Statement of Financial Accounting Standards (“SFAS” or
“Statement”) No. 142, Goodwill and Other Intangible Assets, goodwill deemed to have indefinite
lives is no longer amortized but is subject to annual impairment tests in accordance with the
Statement. Other intangible assets continue to be amortized over their useful lives. We review
the recoverability of goodwill annually or whenever significant events or changes occur which might
impair the recovery of recorded costs. We measure possible impairment based on either significant
losses of an entity or the ability to recover the balance of the long-lived asset from expected
future operating cash flows on an undiscounted basis. If impairment is identified, we would
calculate the amount of such impairment based upon the discounted cash flows or the market values
as compared to the recorded costs. We have performed tests of goodwill as of November 1, 2004 and
2005, and believe that the recorded amounts for goodwill are recoverable and that no impairment
currently exists.
Critical Accounting Estimates
Management’s Discussion and Analysis of Financial Condition and Results of Operations
discusses our Consolidated Financial Statements, which have been prepared in accordance with
accounting principles generally accepted in the United States. When we prepare these consolidated
financial statements, we are required to make estimates and assumptions that affect the reported
amounts of assets and liabilities and the disclosure of contingent assets and liabilities at the
date of the financial statements and the reported amounts of revenues and expenses during the
reporting period. Some of our accounting policies require that we make subjective judgments,
including estimates that involve matters that are inherently uncertain. Our most critical
accounting estimates include those related to accounts receivable, inventories, income taxes,
goodwill and intangible assets and long-lived assets. We base our estimates and judgments on
historical experience and on various other factors that we believe to be reasonable under the
circumstances, the results of which form the basis for our judgments about the carrying values of
assets and liabilities that are not readily apparent from other sources. Our actual results may
differ from these estimates under different assumptions or conditions.
We believe the following critical accounting estimates, as discussed with our Audit Committee,
affect our more significant judgments and estimates used in preparing our consolidated financial
statements. (See Note 1 of the Notes to Consolidated Financial Statements for our Summary of
Significant Accounting Policies.) There have been no material changes made to the critical
accounting estimates during the periods presented in the Consolidated Financial Statements. We
also have other policies that we consider key accounting policies, such as for revenue recognition,
however these policies do not require us to make subjective estimates or judgments.
Accounts Receivable
We maintain an allowance for doubtful accounts to reflect our estimate of the
uncollectibility of accounts receivable based on an evaluation of specific potential customer
risks. Assessments are based on legal issues (bankruptcy status), our past collection
history, current financial and credit agency reports, and the experience of our credit
personnel. Accounts which we determine to be uncollectible are reserved for or written off
in the period in which the determination is made. Additional reserves are maintained based
on our historical and estimated future bad debt experience. If the financial condition of
our customers were to deteriorate beyond our estimates, resulting in an impairment of their
ability to make payments, we might be required to increase our allowance for doubtful
accounts.
31
Table of Contents
Inventories
We maintain allowances for estimated obsolescence or unmarketable inventory to reflect the
difference between the cost of inventory and the estimated market value based on an
evaluation of slow moving products and current replacement costs. If actual market
conditions are less favorable than those anticipated by management, additional allowances may
be required.
Income Taxes
We currently have significant deferred tax assets, which are subject to periodic
recoverability assessments. Realizing our deferred tax assets principally depends upon our
achieving projected future taxable income. We may change our judgments regarding future
profitability due to future market conditions and other factors. We may adjust our deferred
tax asset balances if our judgments change.
For information regarding our provision for income taxes as well as information regarding
differences between our effective tax rate and statutory rates, see Note 7 of the Notes to
Consolidated Financial Statements. Our tax rate may be affected by future acquisitions,
changes in the geographic composition of our income from operations, changes in our estimates
of credits or deductions including those that may result from the American Jobs Creation Act
of 2004, and the resolution of issues arising from tax audits with various tax authorities.
Goodwill and Intangible Assets
In assessing the recoverability of our goodwill and other intangibles we must make
assumptions regarding estimated future cash flows and other factors to determine the fair
value of the respective assets. We have performed impairment testing in accordance with SFAS
No. 142. We perform an annual review in the fourth quarter of each year, or more frequently
if indicators of potential impairment exist, to determine if the carrying value of the
recorded goodwill is impaired. Our impairment review process compares the fair value of the
reporting unit in which goodwill resides to its carrying value. We estimate the reporting
unit’s fair value based on a discounted future cash flow approach that requires us to
estimate income from operations based on historical results and discount rates based on a
weighted average cost of capital of comparable companies. A key assumption made is that, in
general, our revenues will grow at 3% to 5% per year, adjusted for the current economic
outlook. If these estimates or their related assumptions change in the future, we may be
required to record impairment charges for these assets not previously recorded.
Long-Lived Assets
We review the recoverability of our long-lived assets as required by SFAS No. 144 and must
make assumptions regarding estimated future cash flows and other factors to determine the
fair value of the respective assets. If these estimates or their related assumptions change
in the future, we may be required to record impairment charges for these assets not
previously recorded.
Impact of Recently Issued Accounting Standards
In April 2005, the United States Securities and Exchange Commission (“SEC”) approved Statement
of Financial Accounting Standards (“SFAS”) No. 123R, Share-Based Payment, that is effective for us
January 1, 2006. Under SFAS No. 123R, we will be required to record compensation expense related
to share based payments in our consolidated financial statements. Currently, we are only required
to disclose the amount of such expense in the notes to our financial statements. We will apply
this Statement to all awards granted on or after January 1, 2006, to unvested options as of
January 1, 2006, and to awards modified, repurchased, or cancelled after that date. We expect that
the implementation of the provisions of SFAS No. 123R will have an impact consistent with the
disclosures in Note 1 in our Notes to Consolidated Financial Statements.
In May 2005, the FASB issued SFAS No. 154, Accounting Changes and Error Corrections—A
Replacement of APB Opinion No. 20 and FASB Statement No. 3. SFAS No. 154 requires retrospective
application to prior periods’ financial statements for changes in accounting principle, unless it
is impracticable to determine either the period-specific effects or the cumulative effect of the
change. SFAS No. 154 is effective for accounting changes and corrections of errors made in fiscal
years beginning after December 15, 2005.
32
Table of Contents
In June 2005, the FASB’s Emerging Issues Task Force reached a consensus on Issue No. 05-6,
Determining the Amortization Period for Leasehold Improvements (“EITF 05-6”). The guidance
requires that leasehold improvements acquired in a business combination or purchased subsequent to
the inception of a lease be amortized over the lesser of the useful life of the assets or a term
that includes renewals that are reasonably assured at the date of the business combination or
purchase. The guidance is effective for periods beginning after June 29, 2005. The adoption of EITF
05-6 did not have a material impact on our consolidated financial statements.
Item 7A. Quantitative and Qualitative Disclosures About Market Risk.
In the ordinary course of business, we are exposed to various market risk factors, including
changes in general economic conditions, domestic and foreign competition, foreign currency exchange
rates, and metals pricing and availability.
Commodity price risk
Metal prices are volatile due to, among other things, fluctuations in foreign and domestic
production capacity, raw material availability, metals consumption and foreign currency rates.
Decreases in metal prices could adversely affect our revenues, gross profit and net income.
Because we primarily purchase and sell in the “spot” market (i.e., without long-term contracts) we
are able to react to changes in metals pricing.
Foreign exchange rate risk
Because we have foreign operations, we are exposed to foreign currency exchange gains and
losses. Volatility in these markets could impact our net income. Based on our limited foreign
operations we do not consider this risk to be material.
Interest rate risk
We are exposed to market risk related to our fixed rate long-term debt. Market risk is the
potential loss arising from adverse changes in market rates and prices, such as interest rates.
Decreases in interest rates may affect the market value of our fixed-rate debt. Under our current
policies, we do not use interest rate derivative instruments to manage exposure to interest rate
changes. Based on our debt, we do not consider the exposure to interest rate risk to be material.
Our fixed-rate debt obligations are not callable until maturity.
33
Table of Contents
Item 8. Financial Statements and Supplementary Data.
RELIANCE STEEL & ALUMINUM CO.
AUDITED CONSOLIDATED FINANCIAL STATEMENTS
INDEX TO CONSOLIDATED FINANCIAL STATEMENTS AND SUPPLEMENTARY DATA
| Page | ||||
| 35 | ||||
| 36 | ||||
| 37 | ||||
| 38 | ||||
| 39 | ||||
| 40 | ||||
| 59 | ||||
FINANCIAL STATEMENT SCHEDULE: |
||||
| 60 | ||||
All other schedules are omitted because either they are not
applicable, not required or the information required is included
in the Consolidated Financial Statements, including the notes
thereto.
34
Table of Contents
REPORT OF INDEPENDENT REGISTERED PUBLIC ACCOUNTING FIRM
Shareholders and Board of Directors
Reliance Steel & Aluminum Co.
Reliance Steel & Aluminum Co.
We have audited the accompanying consolidated balance sheets of Reliance Steel & Aluminum Co.
and subsidiaries as of December 31, 2005 and 2004, and the related consolidated statements of
income, shareholders’ equity and cash flows for each of the three years in the period ended
December 31, 2005. Our audits also included the financial statement schedule listed in the Index at
Item 15(a). These financial statements and schedule are the responsibility of the Company’s
management. Our responsibility is to express an opinion on these financial statements and schedule
based on our audits.
We conducted our audits in accordance with the standards of the Public Company Accounting
Oversight Board (United States). Those standards require that we plan and perform the audit to
obtain reasonable assurance about whether the financial statements are free of material
misstatement. An audit includes examining, on a test basis, evidence supporting the amounts and
disclosures in the financial statements. An audit also includes assessing the accounting principles
used and significant estimates made by management, as well as evaluating the overall financial
statement presentation. We believe that our audits provide a reasonable basis for our opinion.
In our opinion, the financial statements referred to above present fairly, in all material
respects, the consolidated financial position of Reliance Steel & Aluminum Co. and subsidiaries at
December 31, 2005 and 2004, and the consolidated results of their operations and their cash flows
for each of the three years in the period ended December 31, 2005, in conformity with U.S.
generally accepted accounting principles. Also, in our opinion, the related financial statement
schedule, when considered in relation to the basic financial statements taken as a whole, presents
fairly in all material respects the information set forth therein.
We also have audited, in accordance with the standards of the Public Company Accounting
Oversight Board (United States), the effectiveness of Reliance Steel & Aluminum Co.’s internal
control over financial reporting as of December 31, 2005, based on criteria established in Internal
Control-Integrated Framework issued by the Committee of Sponsoring Organizations of the Treadway
Commission and our report dated March 10, 2006 expressed an unqualified opinion thereon.
/s/ ERNST & YOUNG LLP
Los Angeles, California
March 10, 2006
March 10, 2006
35
Table of Contents
RELIANCE STEEL & ALUMINUM CO.
CONSOLIDATED BALANCE SHEETS
(In thousands, except share amounts)
(In thousands, except share amounts)
| December 31, | ||||||||
| 2005 | 2004 | |||||||
| ASSETS |
||||||||
Current assets: |
||||||||
Cash and cash equivalents |
$ | 35,022 | $ | 11,659 | ||||
Accounts receivable, less allowance for doubtful accounts
of $10,511 and $8,699 at December 31, 2005 and 2004,
respectively |
369,931 | 329,991 | ||||||
Inventories |
387,385 | 349,779 | ||||||
Prepaid expenses and other current assets |
19,009 | 17,216 | ||||||
Deferred income taxes |
36,001 | 24,584 | ||||||
Total current assets |
847,348 | 733,229 | ||||||
Property, plant and equipment, at cost: |
||||||||
Land |
60,207 | 57,982 | ||||||
Buildings |
281,986 | 261,228 | ||||||
Machinery and equipment |
403,403 | 370,229 | ||||||
Accumulated depreciation |
(265,877 | ) | (230,626 | ) | ||||
| 479,719 | 458,813 | |||||||
Goodwill |
384,730 | 341,780 | ||||||
Other assets (including intangibles not subject to amortization) |
57,273 | 29,509 | ||||||
Total assets |
$ | 1,769,070 | $ | 1,563,331 | ||||
| LIABILITIES AND SHAREHOLDERS’ EQUITY |
||||||||
Current liabilities: |
||||||||
Accounts payable |
$ | 188,584 | $ | 140,323 | ||||
Accrued expenses |
19,234 | 17,561 | ||||||
Accrued compensation and retirement costs |
52,354 | 49,959 | ||||||
Accrued insurance costs |
23,372 | 20,297 | ||||||
Deferred income taxes |
214 | 138 | ||||||
Current maturities of long-term debt |
49,525 | 46,400 | ||||||
Current maturities of capital lease obligations |
536 | — | ||||||
Total current liabilities |
333,819 | 274,678 | ||||||
Long-term debt |
301,275 | 380,850 | ||||||
Capital lease obligations |
5,515 | — | ||||||
Long-term retirement costs |
15,660 | 14,102 | ||||||
Deferred income taxes |
65,808 | 55,613 | ||||||
Minority interest |
17,128 | 15,536 | ||||||
Commitments and contingencies |
— | — | ||||||
Shareholders’ equity: |
||||||||
Preferred stock, no par value: |
||||||||
Authorized shares — 5,000,000 |
||||||||
None issued or outstanding |
— | — | ||||||
Common stock, no par value: |
||||||||
Authorized shares — 100,000,000 |
||||||||
Issued and outstanding shares — 33,108,999 and 32,669,967 at
December 31, 2005 and 2004, respectively, stated capital |
325,010 | 313,953 | ||||||
Retained earnings |
704,530 | 508,147 | ||||||
Accumulated other comprehensive income |
325 | 452 | ||||||
Total shareholders’ equity |
1,029,865 | 822,552 | ||||||
Total liabilities and shareholders’ equity |
$ | 1,769,070 | $ | 1,563,331 | ||||
See accompanying notes to consolidated financial statements.
36
Table of Contents
RELIANCE STEEL & ALUMINUM CO.
CONSOLIDATED STATEMENTS OF INCOME
(In thousands, except share and per share amounts)
(In thousands, except share and per share amounts)
| Year Ended December 31, | ||||||||||||
| 2005 | 2004 | 2003 | ||||||||||
Net sales |
$ | 3,367,051 | $ | 2,943,034 | $ | 1,882,933 | ||||||
Other income, net |
3,671 | 4,168 | 2,837 | |||||||||
| 3,370,722 | 2,947,202 | 1,885,770 | ||||||||||
Costs and expenses: |
||||||||||||
Cost of sales (exclusive of depreciation
and amortization shown below) |
2,449,000 | 2,110,848 | 1,372,310 | |||||||||
Warehouse, delivery, selling, general and
administrative |
507,905 | 483,887 | 395,927 | |||||||||
Depreciation and amortization |
46,631 | 44,627 | 36,870 | |||||||||
Interest |
25,222 | 28,690 | 26,745 | |||||||||
| 3,028,758 | 2,668,052 | 1,831,852 | ||||||||||
Income before minority interest
and income taxes |
341,964 | 279,150 | 53,918 | |||||||||
Minority interest |
(8,752 | ) | (9,182 | ) | 938 | |||||||
Income from continuing operations
before income taxes |
333,212 | 269,968 | 54,856 | |||||||||
Provision for income taxes |
127,775 | 100,240 | 20,846 | |||||||||
Net income |
$ | 205,437 | $ | 169,728 | $ | 34,010 | ||||||
Earnings per share: |
||||||||||||
Income from continuing operations —
diluted |
$ | 6.21 | $ | 5.19 | $ | 1.07 | ||||||
Weighted average shares outstanding —
diluted |
33,097,362 | 32,675,379 | 31,866,334 | |||||||||
Income from continuing operations — basic |
$ | 6.24 | $ | 5.23 | $ | 1.07 | ||||||
Weighted average shares outstanding — basic |
32,935,034 | 32,480,101 | 31,852,842 | |||||||||
Cash dividends per share |
$ | .38 | $ | .26 | $ | .24 | ||||||
See accompanying notes to consolidated financial statements.
37
Table of Contents
RELIANCE STEEL & ALUMINUM CO.
CONSOLIDATED STATEMENTS OF SHAREHOLDERS’ EQUITY
(In thousands, except share and per share amounts)
(In thousands, except share and per share amounts)
| Accumulated | ||||||||||||||||||||
| Other | ||||||||||||||||||||
| Common Stock | Retained | Comprehensive | ||||||||||||||||||
| Shares | Amount | Earnings | Income (Loss) | Total | ||||||||||||||||
Balance at January 1, 2003 |
31,752,087 | $ | 294,503 | $ | 317,189 | $ | (1,257 | ) | $ | 610,435 | ||||||||||
Net income for the year |
— | — | 34,010 | — | 34,010 | |||||||||||||||
Other comprehensive income (loss): |
||||||||||||||||||||
Foreign currency translation gain |
— | — | — | 491 | 491 | |||||||||||||||
Unrealized gain on investments |
— | — | — | 212 | 212 | |||||||||||||||
Minimum pension liability |
— | — | — | (376 | ) | (376 | ) | |||||||||||||
Comprehensive income |
34,337 | |||||||||||||||||||
Stock options exercised |
459,375 | 8,866 | 1,406 | — | 10,272 | |||||||||||||||
Stock issued under incentive bonus
plan |
14,410 | 218 | — | — | 218 | |||||||||||||||
Cash dividends — $.24 per share |
— | — | (7,643 | ) | — | (7,643 | ) | |||||||||||||
Balance at December 31, 2003 |
32,225,872 | 303,587 | 344,962 | (930 | ) | 647,619 | ||||||||||||||
Net income for the year |
— | — | 169,728 | — | 169,728 | |||||||||||||||
Other comprehensive income (loss): |
||||||||||||||||||||
Foreign currency translation gain |
— | — | — | 1,476 | 1,476 | |||||||||||||||
Unrealized loss on investments |
— | — | — | (166 | ) | (166 | ) | |||||||||||||
Minimum pension liability |
— | — | — | 72 | 72 | |||||||||||||||
Comprehensive income |
171,110 | |||||||||||||||||||
Stock options exercised |
436,800 | 10,130 | 1,905 | — | 12,035 | |||||||||||||||
Stock issued under incentive bonus
plan |
7,295 | 236 | — | — | 236 | |||||||||||||||
Cash dividends — $.26 per share |
— | — | (8,448 | ) | — | (8,448 | ) | |||||||||||||
Balance at December 31, 2004 |
32,669,967 | 313,953 | 508,147 | 452 | 822,552 | |||||||||||||||
Net income for the year |
— | — | 205,437 | — | 205,437 | |||||||||||||||
Other comprehensive income (loss): |
||||||||||||||||||||
Foreign currency translation gain |
— | — | — | 1 | 1 | |||||||||||||||
Unrealized gain on investments |
— | — | — | 40 | 40 | |||||||||||||||
Minimum pension liability |
— | — | — | (168 | ) | (168 | ) | |||||||||||||
Comprehensive income |
205,310 | |||||||||||||||||||
Stock options exercised |
433,450 | 10,811 | 3,476 | — | 14,287 | |||||||||||||||
Stock issued under incentive bonus
plan |
5,582 | 246 | — | — | 246 | |||||||||||||||
Cash dividends — $.38 per share |
— | — | (12,530 | ) | — | (12,530 | ) | |||||||||||||
Balance at December 31, 2005 |
33,108,999 | $ | 325,010 | $ | 704,530 | $ | 325 | $ | 1,029,865 | |||||||||||
See accompanying notes to consolidated financial statements.
38
Table of Contents
RELIANCE STEEL & ALUMINUM CO.
CONSOLIDATED STATEMENTS OF CASH FLOWS
(In thousands)
(In thousands)
| Year Ended December 31, | ||||||||||||
| 2005 | 2004 | 2003 | ||||||||||
Operating activities: |
||||||||||||
Net income |
$ | 205,437 | $ | 169,728 | $ | 34,010 | ||||||
Adjustments to reconcile net income to net cash
provided by operating activities: |
||||||||||||
Depreciation and amortization |
46,631 | 44,627 | 36,870 | |||||||||
Deferred income taxes |
(1,059 | ) | 2,726 | 8,120 | ||||||||
Gain on sales of property and
equipment |
— | (660 | ) | (701 | ) | |||||||
Minority interest |
8,752 | 9,182 | (938 | ) | ||||||||
Tax benefit of stock options exercised |
3,476 | 1,905 | 1,406 | |||||||||
Changes in operating assets and liabilities: |
||||||||||||
Accounts receivable |
(15,391 | ) | (108,198 | ) | (11,641 | ) | ||||||
Inventories |
(11,345 | ) | (61,699 | ) | 19,995 | |||||||
Prepaid expenses and other assets |
(2,624 | ) | (3,584 | ) | (4,517 | ) | ||||||
Accounts payable and accrued expenses |
38,342 | 67,741 | 25,216 | |||||||||
Net cash provided by operating activities |
272,219 | 121,768 | 107,820 | |||||||||
Investing activities: |
||||||||||||
Purchases of property, plant and
equipment, net |
(53,740 | ) | (35,982 | ) | (20,909 | ) | ||||||
Proceeds from sales of property and equipment |
1,485 | 3,281 | 3,020 | |||||||||
Acquisitions of metals service centers,
net of cash acquired |
(94,377 | ) | — | (245,850 | ) | |||||||
Purchase of minority interest in foreign
subsidiary |
— | (473 | ) | — | ||||||||
Tax reimbursements made related to prior
acquisition |
— | (16,475 | ) | — | ||||||||
Net cash used in investing activities |
(146,632 | ) | (49,649 | ) | (263,739 | ) | ||||||
Financing activities: |
||||||||||||
Proceeds from borrowings |
393,000 | 209,000 | 299,785 | |||||||||
Principal payments on long-term debt and
short-term borrowings |
(486,511 | ) | (273,400 | ) | (152,540 | ) | ||||||
Payments to minority shareholders |
(7,159 | ) | (1,709 | ) | (378 | ) | ||||||
Dividends paid |
(12,530 | ) | (8,448 | ) | (7,643 | ) | ||||||
Issuance of common stock |
246 | 236 | 218 | |||||||||
Exercise of stock options |
10,811 | 10,130 | 8,866 | |||||||||
Net cash (used in) provided by financing
activities |
(102,143 | ) | (64,191 | ) | 148,308 | |||||||
Effect of exchange rate changes on cash |
(81 | ) | 1,565 | 472 | ||||||||
Increase (decrease) in cash and cash equivalents |
23,363 | 9,493 | (7,139 | ) | ||||||||
Cash and cash equivalents at beginning of year |
11,659 | 2,166 | 9,305 | |||||||||
Cash and cash equivalents at end of year |
$ | 35,022 | $ | 11,659 | $ | 2,166 | ||||||
Supplemental cash flow information: |
||||||||||||
Interest paid during the period |
$ | 25,309 | $ | 28,525 | $ | 23,391 | ||||||
Income taxes paid during the period |
$ | 118,909 | $ | 100,589 | $ | 10,346 | ||||||
See accompanying notes to consolidated financial statements.
39
Table of Contents
RELIANCE STEEL & ALUMINUM CO.
NOTES TO CONSOLIDATED FINANCIAL STATEMENTS
December 31, 2005
December 31, 2005
1.
Summary of Significant Accounting Policies
Principles of Consolidation
The accompanying consolidated financial statements include the accounts of Reliance Steel &
Aluminum Co. and its subsidiaries, which include Allegheny Steel Distributors, Inc., Aluminum and
Stainless, Inc., American Metals Corporation, American Steel, L.L.C. (50.5%-owned until January 3,
2006 when it became wholly-owned), AMI Metals, Inc., CCC Steel, Inc., Central Plains Steel Co.,
Chapel Steel Corp., Chatham Steel Corporation, Durrett Sheppard Steel Co., Inc., Liebovich Bros.,
Inc., Lusk Metals, Pacific Metal Company, PDM Steel Service Centers, Inc., Phoenix Corporation,
Precision Strip, Inc., Reliance Pan Pacific Pte., Ltd. (70%-owned), RSAC Management Corp., Service
Steel Aerospace Corp., Siskin Steel & Supply Company, Inc., Toma Metals, Inc., Valex Corp.
(97%-owned) and Viking Materials, Inc., on a consolidated basis (“Reliance” or “the Company”). All
subsidiaries of Reliance, other than American Steel, L.L.C., are held by RSAC Management Corp. All
significant intercompany transactions have been eliminated in consolidation. The Company
consolidates its 50.5% investment in American Steel, L.L.C. and its 70% investment in Reliance Pan
Pacific Pte., Ltd. Effective January 3, 2006, the Company purchased the remaining 49.5% interest
in American Steel, L.L.C. During 2004, Valex Corp. purchased an additional interest in Valex Korea
Co., Ltd. from their former minority partner and accounts for their 99% investment in Valex Korea
on a consolidated basis. Through July 2004, Valex Corp. reported the 30.5% interest owned by its
former partner as minority interest. Certain reclassifications have been made to the prior year
financial statements to conform to the 2005 presentation.
Business
In 2005, the Company operated a metals service center network of more than 100 locations
(including American Steel, L.L.C.) in 31 states, Belgium, France and South Korea which provided
value-added metals processing services and distributed a full line of more than 95,000 metal
products.
Accounting Estimates
The preparation of financial statements in conformity with accounting principles generally
accepted in the United States requires management to make estimates and assumptions that affect the
reported amounts of assets and liabilities and disclosure of contingent assets and liabilities at
the date of the financial statements and the reported amounts of revenue and expenses during the
reporting period. Actual results could differ from those estimates.
Accounts Receivable and Concentrations of Credit Risk
Concentrations of credit risk with respect to trade receivables are limited due to the
geographically diverse customer base and various industries into which the Company’s products are
sold. Trade receivables are typically non-interest bearing and are initially recorded at cost.
Sales to the Company’s recurring customers are generally made on open account terms while sales to
occasional customers may be made on a C.O.D. basis when collectibility is not assured. Past due
status of customer accounts is determined based on how recently payments have been received in
relation to payment terms granted. Credit is generally extended based upon an evaluation of each
customer’s financial condition, with terms consistent in the industry and no collateral required.
Losses from credit sales are provided for in the financial statements and consistently have been
within the allowance provided. The allowance is an estimate of the uncollectibility of accounts
receivable based on an evaluation of specific customer risks along with additional reserves based
on historical and estimated future bad debt experience. Amounts are written off against the
allowance in the period the Company determines that the receivable is uncollectible. As a result
of the above factors, the Company does not consider itself to have any significant concentrations
of credit risk.
Inventory
A significant portion of our inventory is valued using the last-in, first-out (LIFO) method.
Under this method, older costs are included in inventory, which may be higher or lower than current
costs. This method of valuation is subject to year-to-year fluctuations in cost of material sold,
which is influenced by the inflation or deflation existing within the metals industry as well as
fluctuations in our product mix and on-hand inventory levels.
40
Table of Contents
RELIANCE STEEL & ALUMINUM CO.
NOTES TO CONSOLIDATED FINANCIAL STATEMENTS — (Continued)
December 31, 2005
December 31, 2005
Fair Values of Financial Instruments
Fair values of cash and cash equivalents, trade accounts receivable and the current portion of
long-term debt approximate cost due to the short period of time to maturity. Fair values of
long-term debt, which have been determined based on borrowing rates currently available to the
Company, or to other companies with comparable credit ratings, for loans with similar terms or
maturity, approximate the carrying amounts in the consolidated financial statements.
Cash Equivalents
The Company considers all highly liquid instruments with an original maturity of three months
or less when purchased to be cash equivalents. The Company maintains cash and cash equivalents
with high-credit, quality financial institutions. The Company, by policy, limits the amount of
credit exposure to any one financial institution. At times, cash balances held at financial
institutions were in excess of federally-insured limits.
Long-Lived Assets
In accordance with the Financial Accounting Standards Board (“FASB”) Statement of Financial
Accounting Standards (“SFAS”) No. 141, Business Combinations and SFAS No. 142, Goodwill and Other
Intangible Assets, the Company no longer amortizes goodwill which is deemed to have an indefinite
life but is subject to annual impairment tests. Other intangible assets continue to be amortized
over their useful lives. Indefinite-lived intangible assets are not subject to amortization.
For purposes of performing annual impairment tests, the Company identified reporting units in
accordance with the guidance provided within SFAS No. 131, Disclosures about Segments of an
Enterprise and Related Information. As of November 1, 2005 and 2004, the dates of our annual
impairment testing, the Company identified 38 reporting units. Each reporting unit constitutes a
business under the definition provided by EITF 98-3, Determining Whether a Non-Monetary Transaction
Involves Receipt of Productive Assets or of a Business. The Company assigns goodwill at the
business unit/reporting unit level at the time of acquisition, where applicable, as each business
unit operates independently from the other business units and is evaluated at the business unit
level for financial performance.
The Company tests for impairment of goodwill by calculating the fair value of a reporting unit
using the discounted cash flow method. Under this method, the fair market value of each reporting
unit is estimated based on expected future economic benefits discounted to a present value at a
rate of return commensurate with the risk associated with the investment. Year five of these
projections is considered the terminal year. Projected cash flows are discounted to present value
using an estimated weighted average cost of capital, which considers both returns to equity and
debt investors. An annual assessment was performed and the Company determined that no impairment
existed at November 1, 2005 or November 1, 2004.
Property, plant and equipment is recorded at cost and the provision for depreciation of these
assets is generally computed on the straight-line method at rates designed to distribute the cost
of assets over the useful lives, estimated as follows:
Buildings
|
311/2 years | |
Machinery and equipment
|
3-20 years |
The Company reviews the recoverability of its long-lived assets as required by SFAS No.
144, Accounting for the Impairment or Disposal of Long-Lived Assets, whenever events or changes in
circumstances indicate that the carrying amount of such assets may not be recoverable. The
estimated future cash flows are based upon, among other things, assumptions about future operating
performance, and may differ from actual cash flows. Long-lived assets evaluated for impairment are
grouped with other assets to the lowest level for which identifiable cash flows are largely
independent of the cash flows of other groups of assets and liabilities. If the sum of the
projected undiscounted cash flows (excluding interest) is less than
the carrying value of the
assets, the assets will be written down to the estimated fair value in the period in which the
determination is made. The Company has determined that no impairment of long-lived assets exists
as of December 31, 2005 or 2004.
41
Table of Contents
RELIANCE STEEL & ALUMINUM CO.
NOTES TO CONSOLIDATED FINANCIAL STATEMENTS — (Continued)
December 31, 2005
December 31, 2005
Revenue Recognition
The Company recognizes revenue from product or processing sales upon concluding that all of
the fundamental criteria for product revenue recognition have been met. Such criteria are usually
met at the time title to the product passes to the customer, typically upon delivery, or at the
time services are performed for its toll processing services. Shipping and handling charges are
included as revenue in net sales. Costs incurred in connection with shipping and handling the
Company’s products which are related to third-party carriers are not material and are typically
included in cost of sales. Costs incurred in connection with shipping and handling the Company’s
products that are performed by Company personnel are typically included in operating expenses. For
the years ended December 31, 2005, 2004 and 2003, shipping and handling costs included in
“Warehouse, delivery, selling, general and administrative expenses” were approximately $75,868,000,
$71,615,000, and $64,038,000, respectively.
Segment Information
The Company has one reportable business segment — metals service centers. The acquisition
made during 2005 did not result in new segments.
Although a variety of products or services are sold at each of the Company’s various
locations, in total, sales were comprised of the following in each of the three years ended
December 31:
| 2005 | 2004 | 2003 | ||||||||||
Carbon steel |
55 | % | 59 | % | 54 | % | ||||||
Aluminum |
20 | 18 | 24 | |||||||||
Stainless steel |
15 | 14 | 14 | |||||||||
Toll processing |
4 | 4 | 3 | |||||||||
Other |
6 | 5 | 5 | |||||||||
Total |
100 | % | 100 | % | 100 | % | ||||||
Stock-Based Compensation
The Company grants stock options with an exercise price equal to the fair value of the stock
at the date of grant. The Company elected to continue to account for stock-based compensation
plans using the intrinsic value-based method of accounting prescribed by Accounting Principles
Board Opinion (“APB”) No. 25, Accounting for Stock Issued to Employees and related interpretations
through December 31, 2005. Under APB No. 25, because the exercise price of the Company’s employee
stock options equals the market price of the underlying stock at the date of grant, no compensation
expense is recognized.
42
Table of Contents
RELIANCE STEEL & ALUMINUM CO.
NOTES TO CONSOLIDATED FINANCIAL STATEMENTS — (Continued)
December 31, 2005
December 31, 2005
In accordance with SFAS No. 148, Accounting for Stock-Based Compensation — Transition and
Disclosure, the Company is required to disclose the compensation expense as if the Company had
elected to recognize compensation cost based on the fair value of the options granted at the grant
date as prescribed by SFAS No. 148. Under SFAS No. 148, net income and earnings per share would
have been reduced to the pro forma amounts shown below:
| Year Ended December 31, | ||||||||||||
| 2005 | 2004 | 2003 | ||||||||||
| (in thousands, except per share amounts) | ||||||||||||
Reported net income |
$ | 205,437 | $ | 169,728 | $ | 34,010 | ||||||
Stock-based employee compensation
cost, net of tax |
2,954 | 1,149 | 820 | |||||||||
Pro forma net income |
$ | 202,483 | $ | 168,579 | $ | 33,190 | ||||||
Earnings per share from
continuing operations: |
||||||||||||
Basic — reported |
$ | 6.24 | $ | 5.23 | $ | 1.07 | ||||||
Basic — pro forma |
$ | 6.15 | $ | 5.19 | $ | 1.04 | ||||||
Diluted — reported |
$ | 6.21 | $ | 5.19 | $ | 1.07 | ||||||
Diluted — pro forma |
$ | 6.12 | $ | 5.16 | $ | 1.04 | ||||||
The fair value of each option grant was estimated on the date of grant using the
Black-Scholes option pricing model using the following weighted average assumptions:
| 2005 | 2004 | 2003 | ||||||||||
Risk free interest rate |
4.25 | % | 3.25 | % | 3.13 | % | ||||||
Expected life in years |
4 | 4 | 4 | |||||||||
Expected volatility |
.27 | .28 | .29 | |||||||||
Expected dividend yield |
.80 | % | .72 | % | 1.10 | % | ||||||
Environmental Remediation Costs
The Company accrues for losses associated with environmental remediation obligations when such
losses are probable and reasonably estimable. Accruals for estimated losses from environmental
remediation obligations generally are recognized no later than completion of the remediation
feasibility study. Such accruals are adjusted as further information develops or circumstances
change. Recoveries of environmental remediation costs from other parties are recorded as assets
when their receipt is deemed probable. The Company’s management is not aware of any environmental
remediation obligations which would materially affect the operations, financial position or cash
flows of the Company.
Foreign Currencies
The currency effects of translating the financial statements of those foreign subsidiaries of
the Company which operate in local currency environments are included in the “Accumulated Other
Comprehensive Income (Loss)” component of shareholders’ equity. Gains and losses resulting from
foreign currency transactions are included in results of operations and were not material in each
of the three years in the period ended December 31, 2005.
Impact of Recently Issued Accounting Standards
In April 2005, the United States Securities and Exchange Commission (“SEC”) approved a new
rule that delayed the effective date of SFAS No.
123R, Share-Based Payment. SFAS No. 123R
requires companies to record compensation expense related to share-based payments in their
financial statements, among other things. Except for this deferral of the effective date, the
guidance in SFAS No. 123R is unchanged. Under the SEC’s rule, SFAS No. 123R is now effective for
the Company for annual, rather than interim, periods that begin after June 15, 2005. The Company
will apply this Statement to all awards granted on or after January 1, 2006, to unvested options
as of January 1, 2006, and to awards modified, repurchased, or cancelled after that date. We expect
that the implementation of the provisions of SFAS No. 123R will have an impact consistent with our
disclosures under SFAS No. 148 in Note 1.
43
Table of Contents
RELIANCE STEEL & ALUMINUM CO.
NOTES TO CONSOLIDATED FINANCIAL STATEMENTS — (Continued)
December 31, 2005
December 31, 2005
In May 2005, the FASB issued SFAS No. 154, Accounting Changes and Error Corrections—A
Replacement of APB Opinion No. 20 and FASB Statement No. 3. SFAS No. 154 requires retrospective
application to prior periods’ financial statements for changes in accounting principle, unless it
is impracticable to determine either the period-specific effects or the cumulative effect of the
change. SFAS No. 154 is effective for accounting changes and corrections of errors made in fiscal
years beginning after December 15, 2005.
In June 2005, the FASB’s Emerging Issues Task Force reached a consensus on Issue No. 05-6,
Determining the Amortization Period for Leasehold Improvements (“EITF 05-6”). The guidance
requires that leasehold improvements acquired in a business combination or purchased subsequent to
the inception of a lease be amortized over the lesser of the useful life of the assets or a term
that includes renewals that are reasonably assured at the date of the business combination or
purchase. The guidance is effective for periods beginning after June 29, 2005. The adoption of EITF
05-6 did not have a material impact on our consolidated financial statements.
2. Investments in Joint Venture Companies
From inception on July 1, 1995 through April 30, 2002, the Company owned a 50% interest in the
Membership Units of American Steel, L.L.C. (“American Steel”), which operates metals service
centers in Portland, Oregon and Kent (Seattle), Washington, and processes and distributes primarily
carbon steel products. American Industries, Inc. (“Industries”) owned the other 50% interest in
American Steel. The Operating Agreement (“Agreement”) gave the Company operating control over the
assets and operations of American Steel. However, due to the existence of super-majority veto
rights in favor of Industries prior to May 1, 2002, the Company accounted for this investment under
the equity method and recorded its share of earnings based upon the terms of the Agreement.
Effective May 1, 2002, the Agreement was amended and one additional membership unit was issued
to the Company, giving the Company 50.5% of the outstanding membership units. As part of the
amendment, all super-majority and unanimous voting rights included in the Agreement were
eliminated, among other changes. The Agreement, as amended, provided that the Company may purchase
the remaining 49.5% of American Steel during a term of 90 days following the earlier of the death
of the owner of Industries or April 1, 2006 and was required to purchase the remaining 49.5% of
American Steel if Industries so elected during a term of 90 days following the earlier of the death
of the owner of Industries or January 1, 2006. Due to this change in ownership structure, the
Company began consolidating American Steel’s financial results as of May 1, 2002. In January 2006,
in accordance with the Agreement, the Company purchased the remaining 49.5% interest in American
Steel L.L.C for $12,000,000.
In October 2005, the Company, with its partner Manufacturing Network Pte. Ltd. (“MNPL”), a
Singapore company, formed Reliance Pan Pacific Pte., Ltd. (“RPP”). RPP, a Singapore company, is
70%-owned by the Company and 30%-owned by MNPL. RPP had no activity in 2005.
3. Acquisitions
2005 Acquisition
On July 1, 2005, the Company acquired 100% of the outstanding capital stock of Chapel Steel
Corp. (“Chapel Steel”), headquartered in Spring House (Philadelphia), Pennsylvania. The Company
paid approximately $94,200,000 in cash for the equity of Chapel Steel and assumed approximately
$16,800,000 of Chapel Steel’s debt.
Chapel Steel is a privately held metals service center company founded in 1972 that processes
and distributes carbon and alloy steel plate products from five facilities in Pottstown
(Philadelphia), PA; Bourbonnais (Chicago), IL; Houston, TX; Birmingham, AL; and Portland, OR.
Chapel Steel also warehouses and distributes its products in Cincinnati, OH and Hamilton, Ontario,
Canada. Chapel Steel now operates as a wholly-owned subsidiary of RSAC Management Corp., a wholly
owned subsidiary of Reliance.
44
Table of Contents
RELIANCE STEEL & ALUMINUM CO.
NOTES TO CONSOLIDATED FINANCIAL STATEMENTS — (Continued)
December 31, 2005
December 31, 2005
The acquisition was funded on July 1, 2005 with borrowings on the Company’s existing
$600,000,000 syndicated credit facility. A portion of the purchase price, $5,000,000, was paid
into an escrow account that will be released to the sellers after satisfaction of certain
indemnification obligations by the sellers. The following table summarizes the allocation of the
total purchase price to the fair values of the assets acquired and liabilities assumed of Chapel
Steel at the date of the acquisition:
| At July 1, 2005 | ||||
| (in thousands) | ||||
Cash |
$ | 21 | ||
Accounts receivable |
24,549 | |||
Inventory |
26,261 | |||
Property, plant and equipment |
11,076 | |||
Goodwill |
42,949 | |||
Intangible assets subject to amortization |
10,700 | |||
Intangible assets not subject to amortization |
19,000 | |||
Other current and long-term assets |
1,293 | |||
Total assets acquired |
135,849 | |||
Capital lease obligations |
(6,332 | ) | ||
Borrowings on line of credit |
(16,780 | ) | ||
Other current liabilities |
(18,342 | ) | ||
Total liabilities assumed |
(41,454 | ) | ||
Net assets acquired |
$ | 94,395 | ||
The operating results of Chapel Steel are included in the Company’s consolidated results
of operations from the date of acquisition. The following unaudited pro forma summary financial
results present the consolidated results of operations as if the acquisition had occurred at the
beginning of the year of acquisition and the year immediately preceding, after the effect of
certain adjustments, including increased depreciation expense resulting from recording fixed assets
at fair value, interest expense on the acquisition debt, amortization of certain identifiable
intangible assets, and a provision for income taxes, as Chapel Steel was previously taxed as an
S-Corporation under Section 1361 of the Internal Revenue Code. These adjustments are discussed in
detail in the Company’s filing on Form 8-K/A filed with the Securities and Exchange Commission on
September 16, 2005. The pro forma results have been presented for comparative purposes only and are
not indicative of what would have occurred had the acquisition been made as of January 1, 2005 or
2004, or of any potential results which may occur in the future.
| Year Ended December 31, | ||||||||
| 2005 | 2004 | |||||||
| (In thousands, except per share amounts) | ||||||||
Pro forma (unaudited): |
||||||||
Net sales |
$ | 3,503,759 | $ | 3,216,503 | ||||
Net income |
$ | 212,600 | $ | 202,842 | ||||
Earnings per share — diluted |
$ | 6.42 | $ | 6.21 | ||||
Earnings per share — basic |
$ | 6.46 | $ | 6.25 | ||||
2003 Acquisition
On July 1, 2003 the Company acquired all of the outstanding stock of Precision Strip, Inc., a
privately-held metals processing company founded in 1977, and its related entity, Precision Strip
Transport, Inc. (collectively “Precision Strip”) for $220,000,000 in cash, plus the assumption of
approximately $25,600,000 of debt. Precision Strip’s activities consist primarily of slitting and
blanking carbon steel, stainless steel and aluminum flat-rolled products on a “toll” basis, that
is, processing the metal for a fee, without taking ownership of the metal. The business has
facilities in Minster, Kenton, Middletown and Tipp City, Ohio; Anderson and Rockport, Indiana;
Bowling Green, Kentucky; and Talladega, Alabama. Precision Strip’s customers include carbon steel,
stainless steel and aluminum mills, as well as companies in the automotive, appliance, metal
furniture and capital goods industries. Precision Strip now operates as a wholly-owned subsidiary
of Reliance, with Precision Strip Transport, Inc. operating as a wholly-owned subsidiary of
Precision Strip, Inc. This acquisition strengthened our presence in certain geographic and
customer end markets and increased our value-add processing capabilities.
The acquisition of Precision Strip was funded on July 1, 2003 with borrowings on the Company’s
$335,000,000 syndicated bank line of credit and with a new private placement of $135,000,000 of
senior secured notes. Private placement notes of $60,000,000 will mature in 2011 and bear interest
at a rate of 4.87% and notes totaling $75,000,000 will mature in 2013 and bear interest at a rate
of 5.35%. See Note 6 for further discussion. In April 2004, $16,475,000 was paid to the Precision
Strip sellers as reimbursement for income tax payments related to Reliance’s election of Section
338(h)(10) treatment. This amount was in addition to the original purchase price. A portion of
the purchase price, $11,000,000, that the Company had paid into an
escrow account was released to
the sellers in January 2005, as specified in the acquisition agreement, after satisfaction of
certain indemnification obligations by the sellers.
45
Table of Contents
RELIANCE STEEL & ALUMINUM CO.
NOTES TO CONSOLIDATED FINANCIAL STATEMENTS — (Continued)
December 31, 2005
December 31, 2005
The following table summarizes the allocation of the total purchase price to the fair values
of the assets acquired and liabilities assumed of Precision Strip at the date of the acquisition,
adjusted for the additional payment to the sellers in April 2004.
| At July 1, 2003 | ||||
| (in thousands) | ||||
Cash |
$ | 70 | ||
Accounts receivable |
19,961 | |||
Property, plant and equipment |
176,658 | |||
Goodwill |
60,477 | |||
Intangible assets subject to amortization |
6,200 | |||
Intangible assets not subject to amortization |
6,300 | |||
Other assets |
2,799 | |||
Total assets acquired |
272,465 | |||
Current liabilities |
(8,090 | ) | ||
Total liabilities assumed |
(35,691 | ) | ||
Net assets acquired |
$ | 236,774 | ||
Both the Chapel Steel and Precision Strip acquisitions were accounted for by the purchase
method of accounting and, accordingly, the purchase price has been allocated to the assets acquired
and the liabilities assumed based on the estimated fair value at the date of the acquisition. The
Company utilized the services of a valuation specialist to assist in identifying and determining
the fair market values and economic lives of intangible assets of acquired companies.
As part of the purchase price allocation of Chapel Steel and Precision Strip, $19,000,000 and
$6,300,000, respectively, were allocated to the trade names acquired that are not subject to
amortization. The Company determined that the trade name acquired
in connection with both acquisitions had indefinite lives since their economic lives are
expected to approximate the life of each company acquired. Additionally, the Company recorded
other identifiable intangible assets related to customer relationships for Chapel Steel and
Precision Strip of $10,700,000 and $6,200,000, respectively, with weighted average lives of 8.5 and
6.1 years, respectively. The entire goodwill amount from both acquisitions is expected to be
deducted for tax purposes in future years.
4. Intangible Assets
At December 31, 2005 and 2004, net intangible assets of approximately $44,386,000 and
$16,671,000, respectively, are included in other assets, and consist of the following:
| 2005 | 2004 | |||||||||||||||
| Gross | Gross | |||||||||||||||
| Carrying | Accumulated | Carrying | Accumulated | |||||||||||||
| Amount | Amortization | Amount | Amortization | |||||||||||||
| (in thousands) | ||||||||||||||||
Covenants not to compete |
$ | 6,053 | $ | (5,912 | ) | $ | 5,953 | $ | (5,717 | ) | ||||||
Loan fees |
7,689 | (4,938 | ) | 5,550 | (3,126 | ) | ||||||||||
Customer list/relationships |
17,900 | (4,794 | ) | 7,300 | (2,728 | ) | ||||||||||
Trade names |
28,300 | — | 9,300 | — | ||||||||||||
Other |
429 | (341 | ) | 429 | (290 | ) | ||||||||||
| $ | 60,371 | $ | (15,985 | ) | $ | 28,532 | $ | (11,861 | ) | |||||||
46
Table of Contents
RELIANCE STEEL & ALUMINUM CO.
NOTES TO CONSOLIDATED FINANCIAL STATEMENTS — (Continued)
December 31, 2005
December 31, 2005
Amortization expense for intangible assets amounted to approximately $4,125,000,
$3,208,000 and $2,304,000 for the years ended December 31, 2005, 2004 and 2003, respectively.
The following is a summary of estimated aggregate amortization expense for each of the next
five years (in thousands):
2006 |
$ | 3,005 | ||
2007 |
2,925 | |||
2008 |
2,524 | |||
2009 |
1,923 | |||
2010 |
1,692 |
5. Inventories
Inventories of the Company have primarily been stated on the last-in, first-out (“LIFO”)
method, which is not in excess of market. The Company uses the LIFO method of inventory valuation
because it results in better matching of costs and revenues. At December 31, 2005 and 2004, cost
on the first-in, first-out (“FIFO”) method exceeds the LIFO value of inventories by $142,484,000
and $125,893,000, respectively. Inventories of $97,634,000 and $89,905,000 at December 31, 2005
and 2004, respectively, were stated on the FIFO method, which is not in excess of market.
6. Long-Term Debt
Long-term debt consists of the following:
| December 31, | December 31, | |||||||
| 2005 | 2004 | |||||||
| (In thousands) | ||||||||
Revolving line of credit ($335,000,000 limit) originally
due October 24, 2006, terminated June 13, 2005, interest
at variable rates, weighted average rate of 3.66% during
the period from January 1, 2005 through June 13, 2005
(3.09% during 2004) |
$ | — | $ | 30,000 | ||||
Revolving line of credit ($600,000,000 limit) due June 11, 2010,
interest at variable rates, weighted average rate of
4.27% during the period from June 13, 2005 through
December 31, 2005 |
— | — | ||||||
Senior unsecured notes due from January 2, 2007 to
January 2, 2009, average fixed interest rate of 7.33% |
30,000 | 53,000 | ||||||
Senior unsecured notes due from January 2, 2006 to
January 2, 2008, average fixed interest rate of 7.06% |
55,000 | 55,000 | ||||||
Senior unsecured notes due from October 15, 2006 to
October 15, 2010, average fixed interest rate of 6.60% |
127,000 | 150,000 | ||||||
Senior unsecured notes due from July 1, 2011 to July 2, 2013,
average fixed interest rate of 5.14% |
135,000 | 135,000 | ||||||
Variable Rate Demand Industrial Development Revenue
Bonds, Series 1989 A, due July 1, 2014, with interest
payable quarterly; average interest rate of 2.45% during
2005 (1.25% during 2004) |
2,250 | 2,450 | ||||||
Variable Rate Demand Revenue Bonds, Series 1999, due
March 1, 2009, with interest payable quarterly; average
interest rate of 2.68% during 2005 (1.50% during 2004) |
1,550 | 1,800 | ||||||
Total |
350,800 | 427,250 | ||||||
Less amounts due within one year |
(49,525 | ) | (46,400 | ) | ||||
Total long-term debt |
$ | 301,275 | $ | 380,850 | ||||
The Company, in October 2001, entered into a five-year syndicated credit agreement, as
amended, with ten banks for an unsecured revolving line of credit with a borrowing limit of
$335,000,000. On June 13, 2005, the Company entered into a new $600,000,000, five year, unsecured
syndicated credit agreement with fifteen banks as lenders that replaced the Company’s previous
$335,000,000 credit facility. At December 31, 2005, the Company had $15,245,000 of letters of
credit outstanding under the syndicated credit facility with availability to issue an additional
$34,755,000 of letters of credit. The syndicated credit facility includes a commitment fee on the
unused portion, currently at an annual rate of 0.100%.
The Company has $347,000,000 of outstanding senior unsecured notes issued in private
placements of debt. The outstanding senior notes bear interest at an average fixed rate of 6.17%
and have an average remaining life of 4.2 years, maturing from 2006 to 2013.
47
Table of Contents
RELIANCE STEEL & ALUMINUM CO.
NOTES TO CONSOLIDATED FINANCIAL STATEMENTS — (Continued)
December 31, 2005
December 31, 2005
Both the $335,000,000 syndicated credit agreement, that was replaced, and the senior notes
became secured on July 1, 2003 concurrent with the Company’s acquisition of Precision Strip. The
personal property pledged as collateral included, but was not limited to, the outstanding
securities of each of the Company’s material corporate subsidiaries. The security interest was to
terminate when the Company met certain conditions, including a required leverage ratio. In the
first quarter of 2005 the security interest granted under our $335,000,000 syndicated credit
facility and our senior note agreements was automatically released as the Company met the required
conditions of the release. The senior note agreements and the $600,000,000 credit facility are
unsecured.
The $600,000,000 syndicated credit agreement and senior note agreements require the Company to
maintain a minimum net worth and interest coverage ratio, a maximum leverage ratio, and include
certain restrictions on the amount of cash dividends the Company may pay, among other things.
The following is a summary of aggregate maturities of long-term debt for each of the next five
years (in thousands):
2006 |
$ | 49,525 | ||
2007 |
20,525 | |||
2008 |
55,650 | |||
2009 |
10,700 | |||
2010 |
78,250 | |||
Thereafter |
136,150 | |||
| $ | 350,800 | |||
7. Income Taxes
Deferred income taxes are computed using the liability method and reflect the net tax effects
of temporary differences between the carrying amounts of assets and liabilities for financial
statement purposes and the amounts used for income tax purposes. The provision for income taxes
reflects the taxes to be paid for the period and the change during the period in the deferred tax
assets and liabilities. The Company is subject to audits by various tax authorities which may
result in adjustments to income tax amounts previously reported by the Company. Due to the
uncertainty of the timing of potential audits and adjustments that may result from these audits, no
estimate of a possible range of loss may be made by the Company as of December 31, 2005. As of
December 31, 2005, the Company had available state and city net operating loss carryforwards of
$787,000 to offset future income taxes expiring in years 2006 through 2025.
Significant components of the Company’s deferred tax assets and liabilities are as follows:
| December 31, | ||||||||
| 2005 | 2004 | |||||||
| (in thousands) | ||||||||
Deferred tax assets: |
||||||||
Accrued expenses not currently deductible for tax |
$ | 18,519 | $ | 13,724 | ||||
Inventory costs capitalized for tax purposes |
8,027 | 4,837 | ||||||
Bad debt |
3,861 | 3,126 | ||||||
LIFO inventory |
1,697 | 869 | ||||||
Other |
3,897 | 2,028 | ||||||
Total deferred tax assets |
36,001 | 24,584 | ||||||
Deferred tax liabilities: |
||||||||
Tax over book depreciation |
(38,256 | ) | (34,299 | ) | ||||
Goodwill |
(27,635 | ) | (21,314 | ) | ||||
Other |
(131 | ) | (138 | ) | ||||
Total deferred tax liabilities |
(66,022 | ) | (55,751 | ) | ||||
Net deferred tax liabilities |
$ | (30,021 | ) | $ | (31,167 | ) | ||
48
Table of Contents
RELIANCE STEEL & ALUMINUM CO.
NOTES TO CONSOLIDATED FINANCIAL STATEMENTS — (Continued)
December 31, 2005
December 31, 2005
Significant components of the provision for income taxes attributable to continuing operations
are as follows:
| Year Ended December 31, | ||||||||||||
| 2005 | 2004 | 2003 | ||||||||||
| (in thousands) | ||||||||||||
Current: |
||||||||||||
Federal |
$ | 109,432 | $ | 85,544 | $ | 9,361 | ||||||
State |
16,156 | 11,929 | 3,365 | |||||||||
| 125,588 | 97,473 | 12,726 | ||||||||||
Deferred: |
||||||||||||
Federal |
2,858 | 3,167 | 6,291 | |||||||||
State |
(671 | ) | (400 | ) | 1,829 | |||||||
| 2,187 | 2,767 | 8,120 | ||||||||||
| $ | 127,775 | $ | 100,240 | $ | 20,846 | |||||||
The reconciliation of income tax at the U.S. federal statutory tax rates to income tax
expense is as follows:
| Year Ended December 31, | ||||||||||||
| 2005 | 2004 | 2003 | ||||||||||
Income tax at U.S. federal statutory tax rate |
35.0 | % | 35.0 | % | 35.0 | % | ||||||
State income tax, net of federal tax effect |
3.2 | 2.9 | 4.0 | |||||||||
Other |
0.1 | (0.8 | ) | (1.0 | ) | |||||||
Effective tax rate |
38.3 | % | 37.1 | % | 38.0 | % | ||||||
At December 31, 2005, unremitted earnings of subsidiaries outside of the United States
were approximately $10,500,000, on which no United States taxes had been provided. The Company’s
intention is to reinvest these earnings or to repatriate the earnings only when possible to do so
at minimal additional tax cost. It is not practicable to estimate the amount of additional taxes
that might be payable upon repatriation of foreign earnings. Valex Korea qualifies for a tax
holiday in Korea which consists of a seven-year full exemption from corporate income tax followed
by a 50% exemption for the succeeding three years. The exemption is limited to the amount of the
Company’s initial investment in Valex Korea. The tax holiday began the first year the subsidiary
generated taxable income after utilization of any carryforward losses, which was in 2003. The
dollar effect of the tax savings from the tax holiday were $973,000, or $0.03 per diluted share, in
2005, $1,248,000, or $0.04 per diluted share in 2004, and $139,000 or less than $0.01 per diluted
share in 2003.
The American Jobs Creation Act of 2004 (the Jobs Act) introduced a number of changes to the
income tax laws which may affect the Company in future years. A special one-time tax deduction was
created relating to the repatriation of certain foreign earnings to the United States, provided
certain conditions are met. The Company did not repatriate any earnings that were subject to this
deduction. The Jobs Act also provides for a deduction for income from qualified domestic
production activities, which will be phased in from 2005 through 2010. The Company will continue
to evaluate what, if any, benefits may result from this deduction but does not anticipate that the
benefit, if any, will be significant for 2005.
8. Stock Option Plans
In 1994, the Board of Directors of the Company adopted an Incentive and Non-Qualified Stock
Option Plan (“the 1994 Plan”). In May 2001, the shareholders approved an amendment to the 1994
Plan which increased the number of shares with respect to which options may be granted to 2,500,000
shares. The 1994 Plan expired by its terms on December 31, 2003. There are 524,000 options
granted and outstanding under the 1994 Plan as of December 31, 2005. The 1994 Plan provided for
granting of stock options that were either “incentive stock options” within the meaning of Section
422A of the Internal Revenue Code of
1986 (the “Code”) or “non-qualified stock options,” which do not satisfy the provisions of
Section 422A of the Code. Options were required to be granted at an option price per share not
less than the fair market value of common stock on the date of grant, except that the exercise
price of incentive stock options granted to any employee who owns (or, under pertinent Code
provisions, is deemed to own) more than 10% of the outstanding common stock of the Company, must
equal at least 110% of fair market value on the date of grant.
49
Table of Contents
RELIANCE STEEL & ALUMINUM CO.
NOTES TO CONSOLIDATED FINANCIAL STATEMENTS — (Continued)
December 31, 2005
December 31, 2005
Stock options could not be granted
longer than 10 years from the date of the 1994 Plan. All options granted have five-year terms and
vest at the rate of 25% per year, commencing one year from the date of grant. Transactions under
the 1994 Plan are as follows:
| Weighted Average | ||||||||
| Stock Options | Shares | Exercise Price | ||||||
Outstanding at January 1, 2003 |
1,227,850 | $ | 22.64 | |||||
Granted |
718,000 | $ | 25.08 | |||||
Exercised |
(423,375 | ) | $ | 19.35 | ||||
Expired |
(149,000 | ) | $ | 23.53 | ||||
Outstanding at December 31, 2003 |
1,373,475 | $ | 24.83 | |||||
Exercised |
(367,800 | ) | $ | 24.05 | ||||
Expired |
(31,725 | ) | $ | 24.69 | ||||
Outstanding at December 31, 2004 |
973,950 | $ | 25.13 | |||||
Exercised |
(425,950 | ) | $ | 25.08 | ||||
Expired |
(24,000 | ) | $ | 24.94 | ||||
Outstanding at December 31, 2005 |
524,000 | $ | 25.19 | |||||
In May 2004, the Board of Directors of the Company adopted, and the shareholders
approved, an Incentive and Non-Qualified Stock Option Plan (the “2004 Plan”). This 2004 Plan
reserved 3,000,000 shares of the Company’s Common Stock for issuance upon exercise of stock options
granted under the 2004 Plan. There are 2,007,500 shares available for issuance with 992,500
options granted and outstanding under the 2004 Plan as of December 31, 2005. The 2004 Plan
provides for granting of stock options that may be either “incentive stock options” within the
meaning of Section 422A of the Code or “non-qualified stock options,” which do not satisfy the
provisions of Section 422A of the Code. Options are required to be granted at an option price per
share not less than the fair market value of common stock on the date of grant, except that the
exercise price of incentive stock options granted to any employee who owns (or, under pertinent
Code provisions, is deemed to own) more than 10% of the outstanding common stock of the Company,
must equal at least 110% of fair market value on the date of grant. Stock options may not be
granted longer than 10 years from the date of the 2004 Plan. All options granted have five-year
terms and vest at the rate of 25% per year, commencing one year from the date of grant.
Transactions under the 2004 Plan are as follows:
| Weighted Average | ||||||||
| Stock Options | Shares | Exercise Price | ||||||
Outstanding at January 1, 2005 |
— | $ | — | |||||
Granted |
992,500 | $ | 49.15 | |||||
Exercised |
— | $ | — | |||||
Expired |
— | $ | — | |||||
Outstanding at December 31, 2005 |
992,500 | $ | 49.15 | |||||
In May 1998, the shareholders approved the adoption of a Directors Stock Option Plan for
non-employee directors (the “Directors Plan”), which provides for automatic grants of options to
non-employee directors. In February 1999, the Directors Plan was amended to allow the Board of
Directors of the Company (the “Board”) authority to grant additional options to acquire
the Company’s common stock to non-employee directors. In May 2004 the Directors Plan was
amended so that any unexpired stock options granted under the Directors Plan to a non-employee
director that retires from the Board of Directors at or after the age of 75, become immediately
vested and exercisable, and the director, if he or she so desires, must exercise those options
within ninety (90) days after such retirement or the options shall expire automatically. In May
2005, after approval of the Company’s shareholders, the Directors Plan was further amended and
restated providing that options to acquire 3,000 shares of Common Stock would be automatically
granted to each non-employee director each year and would become 100% exercisable after one year.
Once exercisable, the options would remain exercisable until that date which is ten years after the
date of grant. In addition, the amendment increased the number of shares available for future
grants of options from the 187,000 shares reserved as of May 2005 to 250,000 shares. Options under
the Directors Plan are non-qualified stock options, with an exercise price at fair market value at
the date of grant. All options granted prior to May 2005 expire five years from the date of grant.
None of these stock options become exercisable until one year after the date of grant, unless
specifically approved by the Board. In each of the following four years, 25% of the options become
exercisable on a cumulative basis. As of December 31, 2005, there were 179,500 options available
for issuance under the Directors Plan.
50
Table of Contents
RELIANCE STEEL & ALUMINUM CO.
NOTES TO CONSOLIDATED FINANCIAL STATEMENTS — (Continued)
December 31, 2005
December 31, 2005
Transactions under the Directors Plan are as follows:
| Weighted Average | ||||||||
| Stock Options | Shares | Exercise Price | ||||||
Outstanding at January 1, 2003 |
157,500 | $ | 20.87 | |||||
Granted |
37,500 | $ | 17.11 | |||||
Exercised |
(36,000 | ) | $ | 18.67 | ||||
Expired |
(45,000 | ) | $ | 24.59 | ||||
Outstanding at December 31, 2003 |
114,000 | $ | 18.86 | |||||
Granted |
22,500 | $ | 32.12 | |||||
Exercised |
(69,000 | ) | $ | 18.62 | ||||
Expired |
(15,000 | ) | $ | 18.83 | ||||
Outstanding at December 31, 2004 |
52,500 | $ | 24.87 | |||||
Granted |
18,000 | $ | 36.62 | |||||
Exercised |
(7,500 | ) | $ | 17.11 | ||||
Expired |
— | $ | — | |||||
Outstanding at December 31, 2005 |
63,000 | $ | 29.15 | |||||
The following tabulation summarizes certain information concerning outstanding and
exercisable options at December 31, 2005:
| Options Outstanding | Options Exercisable | |||||||||||||||||||
| Weighted Average | ||||||||||||||||||||
| Remaining | Weighted | Average Exercise | ||||||||||||||||||
| Range of | Outstanding at | Contractual Life | Average | Exercisable at | Price of Options | |||||||||||||||
| Exercise Price | December 31, 2005 | In Years | Exercise Price | December 31, 2005 | Exercisable | |||||||||||||||
$17-$23
|
15,000 | 2.4 | $ | 17.11 | 7,500 | $ | 17.11 | |||||||||||||
$24-$30
|
531,500 | 2.4 | $ | 25.20 | 125,000 | $ | 25.28 | |||||||||||||
$31-$35
|
22,500 | 3.3 | $ | 32.12 | 5,625 | $ | 32.12 | |||||||||||||
$36-$50
|
1,010,500 | 4.9 | $ | 48.93 | — | $ | — | |||||||||||||
$17-$50
|
1,579,500 | 4.0 | $ | 40.40 | 138,125 | $ | 25.11 | |||||||||||||
9. Employee Benefits
The Company has an employee stock ownership plan (“the ESOP”) and trust that has been approved
by the Internal Revenue Service as a qualified plan. The ESOP is a noncontributory plan that
covers certain salaried and hourly employees of the Company. The amount of the annual contribution
is at the discretion of the Board, except that the minimum amount must be sufficient to enable the
ESOP trust to meet its current obligations.
Effective in 1998, the Reliance Steel & Aluminum Co. Master 401(k) Plan (the “Master Plan”)
was established which combined several of the various 401(k) and profit-sharing plans of the
Company and its subsidiaries into one plan. Salaried and certain hourly employees of the Company
and its participating subsidiaries are covered under the Master Plan. The Master Plan allows each
subsidiary’s Board to determine independently the annual matching percentage and maximum
compensation limits or annual profit-sharing contribution. Eligibility occurs after three months
of service, and the Company contribution vests at 25% per year, commencing one year after the
employee enters the Master Plan. Other 401(k) and profit-sharing plans exist as certain
subsidiaries have not yet combined their plans into the Master Plan as of December 31, 2005.
Effective January 1996, the Company adopted a Supplemental Executive Retirement Plan (“SERP”),
which is a nonqualified pension plan that provides post-retirement pension benefits to key officers
of the Company. The SERP is administered by the Compensation and Stock Option Committee of the
Board. Benefits are based upon the employees’ earnings. Life insurance policies were purchased
for most individuals covered by the SERP and are funded by the Company. A separate SERP plan
exists for one of the companies acquired during 1998 and for the Company’s 50.5%-owned company,
each of which provides post-retirement pension benefits to its respective key employees. The SERP
plans do not maintain their own plan assets, therefore plan assets and related disclosures have
been omitted. However, the Company does maintain on its balance sheet assets to fund the SERP
plans with values of $12,379,000 and $12,240,000 at December 31, 2005 and 2004, respectively.
51
Table of Contents
RELIANCE STEEL & ALUMINUM CO.
NOTES TO CONSOLIDATED FINANCIAL STATEMENTS — (Continued)
December 31, 2005
December 31, 2005
The net periodic pension costs for the SERP plans were as follows:
| Year Ended December 31, | ||||||||||||
| 2005 | 2004 | 2003 | ||||||||||
| (in thousands) | ||||||||||||
Service cost |
$ | 414 | $ | 393 | $ | 399 | ||||||
Interest cost |
863 | 796 | 868 | |||||||||
Recognized losses |
159 | 113 | 233 | |||||||||
Prior service cost recognized |
196 | 196 | 196 | |||||||||
| $ | 1,632 | $ | 1,498 | $ | 1,696 | |||||||
The following is a summary of the status of the funding of the SERP plans:
| Year Ended December 31, | ||||||||||||
| 2005 | 2004 | 2003 | ||||||||||
| (in thousands) | ||||||||||||
Change in benefit obligation |
||||||||||||
Benefit obligation at beginning of year |
$ | 14,124 | $ | 15,322 | $ | 13,366 | ||||||
Service cost |
414 | 393 | 399 | |||||||||
Interest cost |
863 | 796 | 868 | |||||||||
Actuarial losses (gains) |
1,137 | (1,730 | ) | 1,224 | ||||||||
Benefits paid |
(699 | ) | (657 | ) | (535 | ) | ||||||
Benefit obligation at end of year |
$ | 15,839 | $ | 14,124 | $ | 15,322 | ||||||
Funded status |
||||||||||||
Funded status of the plan |
$ | (15,839 | ) | $ | (14,124 | ) | $ | (15,322 | ) | |||
Unrecognized net actuarial losses |
3,278 | 2,300 | 4,143 | |||||||||
Unamortized prior service cost |
587 | 782 | 978 | |||||||||
Net amount recognized |
$ | (11,974 | ) | $ | (11,042 | ) | $ | (10,201 | ) | |||
Amounts recognized in the statement of financial position |
||||||||||||
Accrued benefit liability |
$ | (13,049 | ) | $ | (12,092 | ) | $ | (11,796 | ) | |||
Accumulated other comprehensive loss |
1,075 | 1,050 | 1,595 | |||||||||
Net amount recognized |
$ | (11,974 | ) | $ | (11,042 | ) | $ | (10,201 | ) | |||
The accumulated benefit obligation for all SERP plans was $11,064,000 and $11,113,000 at
December 31, 2005 and 2004, respectively.
| Year Ended December 31, | ||||||||
| 2005 | 2004 | |||||||
| (in thousands) | ||||||||
Additional Information |
||||||||
Increase (decrease) in minimum liability included in other
comprehensive income |
$ | 25 | $ | (545 | ) | |||
In determining the actuarial present value of projected benefit obligations for the
Company’s SERP plans, the assumptions were as follows:
| 2005 | 2004 | 2003 | ||||||||||
Weighted average assumptions |
||||||||||||
Discount rate |
6.00 | % | 6.00 | % | 6.00 | % | ||||||
Rate of compensation increase |
3.0%-6.0 | % | 3.0%-6.0 | % | 3.0%-6.0 | % | ||||||
Through the purchase of the net assets of the steel service centers division of Pitt-Des
Moines, Inc. on July 2, 2001, the Company, through its subsidiary PDM Steel Service Centers, Inc.,
maintains defined benefit pension plans for certain of its employees. The Company also maintains a
defined benefit pension plan for the employees of its subsidiary Durrett Sheppard Steel Co., Inc.
These plans generally provide benefits of stated amounts for each year of service or provide
benefits based on the participant’s hourly wage rate and years of service. The plans permit the
sponsor, at any time, to amend or terminate the plans subject to union approval, if applicable.
The PDM Merit Shop Defined Benefit Pension Plan (“Merit Plan”), a non-union plan, was frozen
effective December 31, 2003 and subsequently terminated effective December 31, 2004. All existing
participants in the Merit Plan became 100% vested in their accrued benefits as of the termination
date. No gain or loss has been recognized as a result of the termination. Distributions to
participants will be made in 2006. The affected participants under the Merit Plan are eligible to
participate in the Company’s Master Plan.
52
Table of Contents
RELIANCE STEEL & ALUMINUM CO.
NOTES TO CONSOLIDATED FINANCIAL STATEMENTS — (Continued)
December 31, 2005
December 31, 2005
The net periodic pension costs for the defined benefit pension plans covering certain
employees were as follows:
| Year Ended December 31, | ||||||||||||
| 2005 | 2004 | 2003 | ||||||||||
| (in thousands) | ||||||||||||
Service cost |
$ | 371 | $ | 318 | $ | 431 | ||||||
Interest cost |
491 | 423 | 455 | |||||||||
Expected return on plan assets |
(545 | ) | (500 | ) | (371 | ) | ||||||
Curtailment/settlement gain recognized |
— | — | (599 | ) | ||||||||
Prior service cost recognized |
(5 | ) | (5 | ) | (5 | ) | ||||||
Amortization of loss |
55 | 2 | 44 | |||||||||
| $ | 367 | $ | 238 | $ | (45 | ) | ||||||
The following is a summary of the status of the funding of the defined benefit plans:
| Year Ended December 31, | ||||||||||||
| 2005 | 2004 | 2003 | ||||||||||
| (in thousands) | ||||||||||||
Change in benefit obligation |
||||||||||||
Benefit obligation at beginning of year |
$ | 8,366 | $ | 6,844 | $ | 6,814 | ||||||
Service cost |
371 | 318 | 431 | |||||||||
Interest cost |
491 | 423 | 455 | |||||||||
Actuarial losses (gains) |
904 | 886 | (138 | ) | ||||||||
Benefits paid |
(343 | ) | (268 | ) | (231 | ) | ||||||
Plan amendments |
— | — | 76 | |||||||||
Curtailments or settlements |
— | — | (802 | ) | ||||||||
Discount rate changes |
— | 163 | 239 | |||||||||
Benefit obligation at end of year |
$ | 9,789 | $ | 8,366 | $ | 6,844 | ||||||
| Year Ended December 31, | ||||||||||||
| 2005 | 2004 | 2003 | ||||||||||
| (in thousands) | ||||||||||||
Change in plan assets |
||||||||||||
Fair value of plan assets |
$ | 6,866 | $ | 6,071 | $ | 4,668 | ||||||
Actual return on plan assets |
527 | 546 | 1,346 | |||||||||
Employer contributions |
601 | 527 | 302 | |||||||||
Benefits paid |
(358 | ) | (278 | ) | (245 | ) | ||||||
Fair value of plan assets at end of year |
$ | 7,636 | $ | 6,866 | $ | 6,071 | ||||||
Funded status |
||||||||||||
Funded status of the plan |
$ | (2,153 | ) | $ | (1,500 | ) | $ | (773 | ) | |||
Unrecognized net actuarial losses |
2,270 | 1,389 | 378 | |||||||||
Unamortized prior service cost |
39 | 33 | 27 | |||||||||
Net amount recognized |
$ | 156 | $ | (78 | ) | $ | (368 | ) | ||||
Amounts recognized in the statement of financial position |
||||||||||||
Accrued benefit liability |
$ | (1,413 | ) | $ | (1,397 | ) | $ | (907 | ) | |||
Prepaid benefit cost |
527 | 528 | 528 | |||||||||
Intangible asset |
8 | 8 | 9 | |||||||||
Accumulated other comprehensive income |
1,034 | 783 | 2 | |||||||||
Net amount recognized |
$ | 156 | $ | (78 | ) | $ | (368 | ) | ||||
The accumulated benefit obligation for all defined benefit pension plans was $8,513,000
and $7,464,000 at December 31, 2005 and 2004, respectively.
53
Table of Contents
RELIANCE STEEL & ALUMINUM CO.
NOTES TO CONSOLIDATED FINANCIAL STATEMENTS — (Continued)
December 31, 2005
December 31, 2005
| Year Ended December 31, | ||||||||
| 2005 | 2004 | |||||||
| (in thousands) | ||||||||
Information for pension plans with an
accumulated benefit obligation in
excess of plan assets |
||||||||
Accumulated benefit obligation |
$ | 7,033 | $ | 3,399 | ||||
Fair value of plan assets |
6,106 | 2,447 | ||||||
Additional information |
||||||||
Increase in minimum liability included
in other comprehensive income |
$ | 251 | $ | 13 | ||||
In determining the actuarial present value of projected benefit obligations for the
Company’s defined benefit plans, the assumptions were as follows:
| 2005 | 2004 | 2003 | ||||||||||
Weighted average assumptions to determine benefit obligations |
||||||||||||
Discount rate |
5.2% - 6.0 | % | 5.3% - 6.0 | % | 6.25 | % | ||||||
Expected long-term rate of return on plan assets |
7.5% - 8.5 | % | 7.5% - 8.5 | % | 7.5% - 8.5 | % | ||||||
Rate of compensation increase |
4.0 | % | 4.0 | % | 4.0% - 4.5 | % | ||||||
Weighted average assumptions to determine net cost |
||||||||||||
Discount rate |
5.3% - 6.25 | % | 5.6% - 6.0 | % | 6.25% - 6.75 | % | ||||||
Expected long-term rate of return on plan assets |
7.5% - 8.5 | % | 7.5% - 8.5 | % | 7.5% - 8.5 | % | ||||||
Rate of compensation increase |
4.0 | % | 4.0 | % | 4.0% - 4.5 | % | ||||||
The weighted-average asset allocations of the Company’s defined benefit plans at December
31, 2005 and 2004, by asset category, are as follows:
| 2005 | 2004 | |||||||
Plan Assets |
||||||||
Equity securities |
69 | % | 68 | % | ||||
Debt securities |
25 | 25 | ||||||
Other |
6 | 7 | ||||||
Total |
100 | % | 100 | % | ||||
The above asset allocations are in line with the Company’s target asset allocation ranges
which are as follows: equity securities 50% to 80%, debt securities 20% to 60%, and other assets of
0% to 10%. The Company establishes its estimated long-term return on plan assets considering
various factors including the targeted asset allocation percentages, historic returns and expected
future returns. In 2006, the assets of the terminated defined benefit plan were transferred to
more liquid assets, pending distribution. The Company uses a measurement date of December 31 for
the majority of its SERP and defined benefit plans. Employer contributions to the SERP and defined
benefit plans during 2006 are expected to be $779,000 and $993,000, respectively.
The following is a summary of benefit payments, which reflect expected future employee service
and the termination of the PDM Merit Plan, as appropriate, expected to be paid in the periods
indicated (in thousands):
| Defined | ||||||||
| SERP Plans | Benefit Plans | |||||||
2006 |
$ | 779 | $ | 3,386 | ||||
2007 |
779 | 143 | ||||||
2008 |
792 | 233 | ||||||
2009 |
844 | 280 | ||||||
2010 |
894 | 288 | ||||||
2011 – 2014 |
5,703 | 2,184 | ||||||
54
Table of Contents
RELIANCE STEEL & ALUMINUM CO.
NOTES TO CONSOLIDATED FINANCIAL STATEMENTS — (Continued)
December 31, 2005
December 31, 2005
The Company participates in various multi-employer pension plans covering certain
employees not covered under the Company’s benefit plans pursuant to agreements between the Company
and collective bargaining units, who are members of such plans. In 2005, 2004 and 2003, the
Company made contributions to multi-employer defined benefit plans related to collective bargaining
agreements in the amounts of $2,274,000, $2,204,000 and $2,212,000, respectively.
The Company’s contribution expense for Company-sponsored retirement plans was as follows:
| Year Ended December 31, | ||||||||||||
| 2005 | 2004 | 2003 | ||||||||||
Master Plan |
$ | 7,035 | $ | 6,241 | $ | 4,528 | ||||||
Employee Stock Ownership Plan |
1,000 | 1,000 | 800 | |||||||||
Supplemental Executive Retirement Plans |
1,632 | 1,498 | 1,696 | |||||||||
Defined Benefit Plans |
367 | 238 | (45 | ) | ||||||||
| $ | 10,034 | $ | 8,977 | $ | 6,979 | |||||||
The Company has a “Key-Man Incentive Plan” (the “Incentive Plan”) for division managers
and officers, which is administered by the Compensation and Stock Option Committee of the Board.
For 2005 and 2004, this incentive compensation bonus was payable 75% in cash and 25% in the
Company’s common stock, with the exception of the bonus to officers, which may be paid 100% in cash
at the discretion of the individual. The Company accrued $6,863,000 and $4,057,000 under the
Incentive Plan as of December 31, 2005 and 2004, respectively. In March 2005 and 2004, the Company
issued 5,582 and 7,295
shares of common stock to employees under the incentive bonus plan for the years ended
December 31, 2004 and 2003, respectively. The Company had 87,098 shares of common stock available
for issuance under the Incentive Plan as of December 31, 2005.
10. Shareholders’ Equity
Common Stock
The Company is authorized to issue 100,000,000 shares of common stock, no par value per share.
The Company pays a regular quarterly cash dividend on its common stock, currently at $0.10 per
share. The holders of Reliance common stock are entitled to one vote per share on each matter
submitted to a vote of shareholders.
Share Repurchase Program
In August 1998, the Board approved the purchase of up to an additional 3,750,000 shares of the
Company’s outstanding common stock through its Stock Repurchase Plan (“Repurchase Plan”), for a
total of up to 6,000,000 shares. The Repurchase Plan was initially established in December 1994
and authorized the Company to purchase shares of its common stock from time to time in the open
market or in privately-negotiated transactions. In May 2005, the Board amended and restated the
Repurchase Plan to authorize the purchase of up to an additional 6,000,000 shares of the Company’s
common stock and to extend the term of the Repurchase Plan for ten years, to December 31, 2014.
Repurchased shares are redeemed and treated as authorized but unissued shares. As of December 31,
2005, and prior to the additional authorization in May 2005, the Company had repurchased a total of
5,538,275 shares of its common stock under the Repurchase Plan, at an average cost of $14.94 per
share. The Company did not repurchase any shares in 2005, 2004 or 2003.
Preferred Stock
The Company is authorized to issue 5,000,000 shares of preferred stock, no par value per
share. No shares of the Company’s preferred stock are issued and outstanding. The Company’s
restated articles of incorporation provide that shares of preferred stock may be issued from time
to time in one or more series by the Board. The Board can fix the preferences, conversion and other
rights, voting powers, restrictions, limitations as to dividends, qualifications and terms and
conditions of redemption of each series of preferred stock. The rights of preferred shareholders
may supersede the rights of common shareholders.
55
Table of Contents
RELIANCE STEEL & ALUMINUM CO.
NOTES TO CONSOLIDATED FINANCIAL STATEMENTS — (Continued)
December 31, 2005
December 31, 2005
Accumulated Other Comprehensive Income
SFAS No. 130, Reporting Comprehensive Income, defines comprehensive income (loss) as
non-stockholder changes in equity. Accumulated other comprehensive income (loss) included the
following:
| December 31, | ||||||||
| 2005 | 2004 | |||||||
| (in thousands) | ||||||||
Foreign currency translation adjustments |
$ | 1,500 | $ | 1,499 | ||||
Unrealized gain on investments |
129 | 88 | ||||||
Minimum pension liability |
(1,304 | ) | (1,135 | ) | ||||
| $ | 325 | $ | 452 | |||||
Foreign currency translation adjustments are not generally adjusted for income taxes as they relate
to indefinite investments in foreign subsidiaries. The adjustments to unrealized gain on
investments and minimum pension liability are net of deferred income taxes of ($79,000) and
$804,000, respectively, as of December 31, 2005 and ($54,000) and $692,000, respectively, as of
December 31, 2004.
Registration Statement for the Pending Merger
In connection with the pending acquisition of Earle M. Jorgensen Company as discussed in Note
13, the Company filed a registration statement on SEC Form S-4 that became effective on March 1,
2006. The registration statement on Form S-4 enables the Company to issue up to 6,248,423 shares of
its common stock in connection with this transaction. To date, no securities have been issued
pursuant to this registration statement.
11. Commitments and Contingencies
The Company leases land, buildings and equipment under noncancelable operating leases expiring
in various years through 2018. Several of the leases have renewal options providing for additional
lease periods. Future minimum payments, by year and in the aggregate, under the noncancelable
leases with initial or remaining terms of one year or more, consisted of the following at December
31, 2005 (in thousands):
| Operating | Capital | |||||||
| Leases | Leases | |||||||
2006 |
$ | 17,112 | $ | 780 | ||||
2007 |
16,045 | 780 | ||||||
2008 |
10,897 | 780 | ||||||
2009 |
7,289 | 780 | ||||||
2010 |
5,258 | 780 | ||||||
Thereafter |
6,771 | 3,437 | ||||||
| $ | 63,372 | $ | 7,337 | |||||
Less, interest |
(1,286 | ) | ||||||
Capital lease obligations |
6,051 | |||||||
Less, current portion |
(536 | ) | ||||||
Long-term capital lease obligations |
$ | 5,515 | ||||||
Total rental expense amounted to $22,145,000, $21,625,000 and $20,474,000 for 2005, 2004
and 2003, respectively.
56
Table of Contents
RELIANCE STEEL & ALUMINUM CO.
NOTES TO CONSOLIDATED FINANCIAL STATEMENTS — (Continued)
December 31, 2005
December 31, 2005
Included in the amounts above for operating leases are lease payments to various related
parties, who are not executive officers of the Company, in the amount of $3,766,000, $3,812,000 and
$4,447,000 for 2005, 2004 and 2003, respectively. These related party leases are for buildings
related to certain of the companies we have acquired and expire in various years through 2018.
Also, in connection with the Chapel Steel acquisition, the Company acquired noncancelable
capital leases related to three buildings with terms expiring in various years through 2016. At
December 31, 2005, total obligations under these capital leases were $6,051,000. The carrying
value and accumulated depreciation of those leases at December 31, 2005 were $8,100,000 and
$409,000, respectively. All three capital leases are with related parties who are not executive
officers of the Company.
At December 31, 2005, approximately 12% of the Company’s total employees were covered by
collective bargaining agreements, which expire at various times over the next five years.
Approximately 4% of the Company’s employees were covered by collective bargaining agreements that
expire during 2006.
The Company is subject to legal proceedings and claims and examinations by the IRS and other
taxing authorities which arise in the ordinary course of its business. Although occasional adverse
decisions or settlements may occur, an estimate of potential loss, if any, cannot be reasonably
estimated. However, the Company believes that the final disposition of such matters will not have
a material adverse effect on the financial position, results of operations or cash flow of the
Company.
12. Earnings Per Share
The Company calculates basic and diluted earnings per share as required by SFAS No. 128,
Earnings Per Share. Basic earnings per share excludes any dilutive effects of options, warrants
and convertible securities. Diluted earnings per share is calculated including the dilutive
effects of warrants, options and convertible securities, if any. The following table sets forth
the computation of basic and diluted earnings per share:
| Year Ended December 31, | ||||||||||||
| 2005 | 2004 | 2003 | ||||||||||
| (in thousands, except per share amounts) | ||||||||||||
Numerator: |
||||||||||||
Net income |
$ | 205,437 | $ | 169,728 | $ | 34,010 | ||||||
Denominator: |
||||||||||||
Denominator for basic earnings per share —
weighted average shares |
32,935 | 32,480 | 31,853 | |||||||||
Effect of dilutive securities: |
||||||||||||
Stock options |
162 | 195 | 13 | |||||||||
Denominator for dilutive earnings per share: |
||||||||||||
Adjusted weighted average shares and
assumed conversions |
33,097 | 32,675 | 31,866 | |||||||||
Earnings per share from continuing operations — diluted |
$ | 6.21 | $ | 5.19 | $ | 1.07 | ||||||
Earnings per share from continuing operations — basic |
$ | 6.24 | $ | 5.23 | $ | 1.07 | ||||||
The computations of earnings per share for the years ended December 31, 2005 and 2003 do
not include 992,500 and 1,336,625 shares reserved for issuance upon exercise of stock options,
respectively, because their inclusion would have been anti-dilutive. There were no anti-dilutive
shares reserved for issuance upon exercise of stock options for the year ended December 31, 2004.
57
Table of Contents
RELIANCE STEEL & ALUMINUM CO.
NOTES TO CONSOLIDATED FINANCIAL STATEMENTS — (Continued)
December 31, 2005
December 31, 2005
13. Subsequent Events
In January 2006, the Company entered into a merger agreement to acquire the outstanding stock
of Earle M. Jorgensen Company (“EMJ”) for approximately $13.00 per share in cash and stock, subject
to a collar. The consideration to EMJ stockholders will be paid approximately 50% in cash and
50% in the Company’s common stock, subject to a minimum and maximum number of shares of Reliance
stock. Under the terms of the merger agreement, EMJ stockholders will
have the right to receive consideration of $6.50 in cash and between 0.0892 and 0.1207 of a share of the
Company’s common stock, depending on the average trading price per share of the Company’s common
stock on the New York Stock Exchange for the 20 trading days ending on and including the second
trading day prior to completion of the merger. If the average price of the Company’s common stock
prior to the closing is between $53.86 and $72.86 per share, the value of the Reliance common stock
received would be $6.50 per EMJ share.
The cash portion of approximately $385,000,000, which includes the cash out of certain EMJ
options and estimated transaction costs, will be financed under the Company’s $600,000,000
syndicated credit facility. Additionally, the Company will assume EMJ’s existing long-term debt,
including $250,000,000 of senior secured indentures. The Company obtained amendments to its
$600,000,000 credit facility and its senior unsecured notes in February 2006 that allow the Company
to assume the EMJ indentures, among other things. The amendment to the credit facility also
provides for an increase in the maximum amount available to $700,000,000, to be effective upon
completion of the EMJ acquisition. The Company expects to finalize the merger in early April
2006.
Additionally, effective January 3, 2006, the Company purchased the remaining 49.5% minority
interest in American Steel L.L.C. for $12,000,000. On March 1, 2006, the Company acquired Everest
Metals (Suzhou) Co., Ltd., a metals service center company in China, through its 70%-owned joint
venture company, Reliance Pan Pacific Pte., Ltd.
58
Table of Contents
RELIANCE STEEL & ALUMINUM CO.
QUARTERLY RESULTS OF OPERATIONS (UNAUDITED)
The following is a summary of the quarterly results of operations for the years ended
December 31, 2005, 2004 and 2003:
| March 31, | June 30, | September 30, | December 31, | |||||||||||||
| (in thousands, except per share amounts) | ||||||||||||||||
2005: |
||||||||||||||||
Net sales |
$ | 811,907 | $ | 816,342 | $ | 870,124 | $ | 868,678 | ||||||||
Cost of sales |
$ | 595,971 | $ | 594,107 | $ | 641,396 | $ | 617,526 | ||||||||
Gross profit |
$ | 215,936 | $ | 222,235 | $ | 228,728 | $ | 251,152 | ||||||||
Net income |
$ | 46,363 | $ | 49,049 | $ | 49,437 | $ | 60,588 | ||||||||
Earnings per
share from
continuing
operations —
diluted |
$ | 1.41 | $ | 1.48 | $ | 1.49 | $ | 1.81 | ||||||||
Earnings per
share from
continuing
operations —
basic |
$ | 1.41 | $ | 1.49 | $ | 1.50 | $ | 1.83 | ||||||||
2004: |
||||||||||||||||
Net sales |
$ | 655,765 | $ | 760,780 | $ | 783,670 | $ | 742,819 | ||||||||
Cost of sales |
$ | 468,335 | $ | 532,313 | $ | 568,748 | $ | 541,452 | ||||||||
Gross profit |
$ | 187,430 | $ | 228,467 | $ | 214,922 | $ | 201,367 | ||||||||
Net income |
$ | 29,839 | $ | 52,797 | $ | 44,140 | $ | 42,952 | ||||||||
Earnings per
share from
continuing
operations —
diluted |
$ | .92 | $ | 1.62 | $ | 1.35 | $ | 1.31 | ||||||||
Earnings per
share from
continuing
operations —
basic |
$ | .92 | $ | 1.63 | $ | 1.36 | $ | 1.32 | ||||||||
2003: |
||||||||||||||||
Net sales |
$ | 450,823 | $ | 456,329 | $ | 490,587 | $ | 485,194 | ||||||||
Cost of sales |
$ | 331,420 | $ | 336,957 | $ | 351,625 | $ | 352,308 | ||||||||
Gross profit |
$ | 119,403 | $ | 119,372 | $ | 138,962 | $ | 132,886 | ||||||||
Net income |
$ | 5,579 | $ | 6,392 | $ | 12,353 | $ | 9,686 | ||||||||
Earnings per
share from
continuing
operations —
diluted |
$ | .18 | $ | .20 | $ | .39 | $ | .30 | ||||||||
Earnings per
share from
continuing
operations —
basic |
$ | .18 | $ | .20 | $ | .39 | $ | .30 | ||||||||
Quarterly and year-to-date computations of per share amounts are made independently.
Therefore, the sum of per share amounts for the quarters may not agree with per share amounts for
the year shown elsewhere in the Annual Report on Form 10-K.
59
Table of Contents
RELIANCE STEEL & ALUMINUM CO.
SCHEDULE II — VALUATION AND QUALIFYING ACCOUNTS
(In thousands)
(In thousands)
| Additions | ||||||||||||||||||||
| Balance at | Charged to | Charged to | Balance at | |||||||||||||||||
| Beginning | Costs and | Other | End of | |||||||||||||||||
| Description | of Period | Expenses | Accounts | Deductions | Period | |||||||||||||||
Year Ended December 31, 2003
Allowance for doubtful
accounts |
$ | 5,158 | $ | 4,373 | $ | 600 | $ | 5,415 | (1) | $ | 4,716 | |||||||||
Year Ended December 31, 2004
Allowance for doubtful
accounts |
$ | 4,716 | $ | 9,078 | $ | 266 | $ | 5,361 | (1) | $ | 8,699 | |||||||||
Year Ended December 31, 2005
Allowance for doubtful
accounts |
$ | 8,699 | $ | 5,173 | $ | 556 | $ | 3,917 | (1) | $ | 10,511 | |||||||||
| (1) | Uncollectible accounts written off, net of recoveries. |
60
Table of Contents
RELIANCE STEEL & ALUMINUM CO.
SCHEDULE II — VALUATION AND QUALIFYING ACCOUNTS
(In thousands)
(In thousands)
Item 9. Changes in and Disagreements with Accountants on Accounting and Financial Disclosure.
There have been no changes in or disagreements with the Company’s accountants on any
accounting or financial disclosure issues.
Item 9A. Controls and Procedures.
Disclosure Controls and Procedures
We maintain disclosure controls and procedures, which are designed to ensure that information
required to be disclosed in the reports we file or submit under the Securities Exchange Act of
1934, as amended, is recorded, processed, summarized and reported within time periods specified in
the Securities and Exchange Commission’s rules and forms, and that such information is accumulated
and communicated to our management, including our chief executive officer, or CEO, and chief
financial officer, or CFO, as appropriate to allow timely decisions regarding required disclosure.
Under the supervision and with the participation of the Company’s management, including our
CEO and CFO, an evaluation was performed on the effectiveness of the design and operation of our
disclosure controls and procedures as of the end of the period covered by this annual report. Based
on that evaluation, our management, including our CEO and CFO, concluded that our disclosure
controls and procedures were effective as of December 31, 2005.
An evaluation was also performed under the supervision and with the participation of our
management, including our CEO and CFO, of any change in our internal controls over financial
reporting that occurred during our last fiscal quarter and that has materially affected, or is
reasonably likely to materially affect, our internal controls over financial reporting. That
evaluation did not identify any change in our internal controls over financial reporting that
occurred during our latest fiscal quarter and that has materially affected, or is reasonably likely
to materially affect, our internal controls over financial reporting.
Management’s Report on Internal Control Over Financial Reporting
Our management is responsible for establishing and maintaining adequate internal control over
financial reporting, as this term is defined in Exchange Act Rule 13a-15(f). All internal control
systems, no matter how well designed, have inherent limitations. Therefore, even those systems
determined to be effective can provide only reasonable assurance with respect to financial
statement preparation and presentation.
Under the supervision and with the participation of our management, including our CEO and CFO,
we conducted an evaluation of the effectiveness of our internal control over financial reporting
based on the framework in Internal Control — Integrated Framework issued by the Committee of
Sponsoring Organizations of the Treadway Commission. Based on our evaluation under the framework
in Internal Control — Integrated Framework, our management concluded that our internal control over
financial reporting was effective as of December 31, 2005.
On July 1, 2005, the Company acquired Chapel Steel Corp. Due to the timing of the
acquisition, Chapel Steel Corp. was not included in management’s 2005 assessment of and report on
internal control over financial reporting.
Our management’s assessment of the effectiveness of our internal control over financial
reporting as of December 31, 2005 has been audited by Ernst & Young, LLP, an independent registered
public accounting firm, as stated in their report which is included herein.
Item 9B. Other Information.
None.
61
Table of Contents
REPORT OF INDEPENDENT REGISTERED PUBLIC ACCOUNTING FIRM ON
INTERNAL CONTROL OVER FINANCIAL REPORTING
INTERNAL CONTROL OVER FINANCIAL REPORTING
The Board of Directors and Shareholders of Reliance Steel & Aluminum Co.
We have audited management’s assessment, included in Management’s Report on Internal Control
Over Financial Reporting, that Reliance Steel & Aluminum Co. maintained effective internal control
over financial reporting as of December 31, 2005, based on criteria established in Internal
Control—Integrated Framework issued by the Committee of Sponsoring Organizations of the Treadway
Commission (the COSO criteria). Reliance Steel & Aluminum Co.’s management is responsible for
maintaining effective internal control over financial reporting and for its assessment of the
effectiveness of internal control over financial reporting. Our responsibility is to express an
opinion on management’s assessment and an opinion on the effectiveness of the company’s internal
control over financial reporting based on our audit.
We conducted our audit in accordance with the standards of the Public Company Accounting
Oversight Board (United States). Those standards require that we plan and perform the audit to
obtain reasonable assurance about whether effective internal control over financial reporting was
maintained in all material respects. Our audit included obtaining an understanding of internal
control over financial reporting, evaluating management’s assessment, testing and evaluating the
design and operating effectiveness of internal control, and performing such other procedures as we
considered necessary in the circumstances. We believe that our audit provides a reasonable basis
for our opinion.
A company’s internal control over financial reporting is a process designed to provide
reasonable assurance regarding the reliability of financial reporting and the preparation of
financial statements for external purposes in accordance with generally accepted accounting
principles. A company’s internal control over financial reporting includes those policies and
procedures that (1) pertain to the maintenance of records that, in reasonable detail, accurately
and fairly reflect the transactions and dispositions of the assets of the company; (2) provide
reasonable assurance that transactions are recorded as necessary to permit preparation of financial
statements in accordance with generally accepted accounting principles, and that receipts and
expenditures of the company are being made only in accordance with authorizations of management and
directors of the company; and (3) provide reasonable assurance regarding prevention or timely
detection of unauthorized acquisition, use, or disposition of the company’s assets that could have
a material effect on the financial statements.
Because of its inherent limitations, internal control over financial reporting may not prevent
or detect misstatements. Also, projections of any evaluation of effectiveness to future periods
are subject to the risk that controls may become inadequate because of changes in conditions, or
that the degree of compliance with the policies or procedures may deteriorate.
As indicated in the accompanying Management’s Report on Internal Control over Financial
Reporting, management’s assessment of and conclusion on the effectiveness of internal control over
financial reporting did not include the internal controls of Chapel Steel Corp., which is included
in the 2005 consolidated financial statements of Reliance Steel & Aluminum Co. and constituted 8.0%
and 9.9% of total assets and net assets, respectively, as of December 31, 2005, and 3.9% and 3.6%
of net sales and net income, respectively, for the year then ended. Our audit of internal control
over financial reporting of Reliance Steel & Aluminum Co. also did not include an evaluation of the
internal control over financial reporting of Chapel Steel Corp.
In our opinion, management’s assessment that Reliance Steel & Aluminum Co. maintained
effective internal control over financial reporting as of December 31, 2005, is fairly stated, in
all material respects, based on the COSO criteria. Also, in our opinion, Reliance Steel & Aluminum
Co. maintained, in all material respects, effective internal control over financial reporting as of
December 31, 2005, based on the COSO criteria.
We also have audited, in accordance with the standards of the Public Company Accounting
Oversight Board (United States), the consolidated balance sheets of Reliance Steel & Aluminum Co.
and its subsidiaries as of December 31, 2005 and 2004, and the related consolidated statements of
income, shareholders’ equity, and cash flows for each of the three years in the period ended
December 31, 2005, and our report dated March 10, 2006 expressed an unqualified opinion thereon.
/s/ ERNST & YOUNG LLP
Los Angeles, California
March 10, 2006
March 10, 2006
62
Table of Contents
PART III
Item 10. Directors and Executive Officers of the Registrant.
The following table sets forth certain information regarding our directors and executive
officers:
| Name | Age | Position with Reliance | ||||
David H. Hannah(1)
|
54 | Chief Executive Officer; Director | ||||
Gregg J. Mollins(1)
|
51 | President; Chief Operating Officer; Director | ||||
Karla R. Lewis
|
40 | Executive Vice President; Chief Financial Officer | ||||
James P. MacBeth
|
58 | Senior Vice President, Carbon Steel Operations | ||||
William K. Sales, Jr.
|
48 | Senior Vice President, Non-Ferrous Operations | ||||
Joe D. Crider(1) (4) (5)
|
76 | Non-Executive Chairman of the Board; Director | ||||
Thomas W. Gimbel(1) (5)
|
54 | Director | ||||
Douglas M. Hayes(2) (3) (4)
|
62 | Director | ||||
Franklin R. Johnson(2) (3) (5)
|
69 | Director | ||||
Mark V. Kaminski(1) (4) (5)
|
50 | Director | ||||
Richard J. Slater(2)(5)
|
59 | Director | ||||
Leslie A. Waite(2) (3) (4)
|
60 | Director | ||||
| (1) | Term of office as a director expiring in 2006. | |
| (2) | Term of office as a director expiring in 2007. | |
| (3) | Member of the Audit Committee. | |
| (4) | Member of the Compensation and Stock Option Committee. | |
| (5) | Member of the Nominating and Governance Committee. |
Directors
Joe D. Crider became the Chairman of the Board of Reliance in February 1997. Mr. Crider was
the Chief Executive Officer of Reliance from May 1994 until his retirement in January 1999. Before
becoming the Chief Executive Officer, Mr. Crider had been President and Chief Operating Officer and
a director since 1987 and served in other capacities at the Company since 1975. Mr. Crider serves as a member of
our Compensation and Stock Option Committee and as a member of our Nominating and Governance
Committee. The Board of Directors has determined that Mr. Crider is an independent director.
Thomas W. Gimbel was appointed a director of Reliance in January 1999. Since 1984, Mr. Gimbel
has been the President of Advanced Systems Group, which is an independent computer consulting firm
servicing database requirements for diverse businesses of various sizes. From 1975 to 1984, Mr.
Gimbel was employed by Dun & Bradstreet. Mr. Gimbel serves as a member of our Nominating and
Governance Committee. The Board of Directors has determined that Mr. Gimbel is an independent
director.
David H. Hannah was appointed a director of Reliance in 1992 and became the Chief Executive
Officer of Reliance in January 1999. Mr. Hannah served as President of Reliance from November 1995
to January 2002. Prior to that, he was Executive Vice President and Chief Financial Officer from
1992 to 1995, Vice President and Chief Financial Officer from 1990 to 1992 and Vice President and
Division Manager of the Los Angeles Reliance Steel Company division of Reliance from 1989 to 1990. Mr. Hannah has served as an officer of the Company since 1981. For eight years
before joining Reliance, Mr. Hannah, a certified public accountant, was employed by Ernst & Whinney
(a predecessor to Ernst & Young LLP, our independent registered public accounting firm) in various
professional staff positions.
Douglas M. Hayes became a director of Reliance in September 1997. Mr. Hayes retired from
Donaldson, Lufkin & Jenrette Securities Corporation (“DLJ”), where he was Managing Director of
Investment Banking from 1986 to May 1997, after which he established his own investment firm, Hayes
Capital Corporation, located in Los Angeles, California. DLJ was an underwriter in our 1997 public
equity offering and was also the underwriter in our initial public offering in 1994. Mr. Hayes
serves as a member of our Audit Committee and our Compensation and Stock Option Committee. Mr.
Hayes is also a director of Circor International, Inc., a public company, the securities of which
are traded on the New York Stock Exchange, and for which Mr. Hayes serves as chairman of the
nominating and governance committee and as a member of the compensation committee, and Mr. Hayes
serves as a director of Sands Regent, a public company, the securities of which are traded on
NASDAQ, and for which he serves as chairman of its audit committee. The Board of Directors has determined
that Mr. Hayes is an independent director.
63
Table of Contents
Franklin R. Johnson was appointed a director of Reliance in February 2002. Mr. Johnson is a
certified public accountant, having been the managing partner of the entertainment practice of
Price Waterhouse until he retired in June 1997. Mr. Johnson was the chief financial officer of
Rysher Entertainment, a producer and distributor of films and television shows from June 1997 to
June 1999 and, since July 1999, he has served as a business consultant, a litigation consultant and
an expert witness, none of which services has been provided to
Reliance. Mr. Johnson serves as the
Chairman and a member of our Audit Committee and as a member of our Nominating and Governance
Committee. Mr. Johnson is also a director of Special Value Opportunities Fund, a public fund for
institutional investors organized by Tennenbaum Capital Partners, for which Mr. Johnson is chairman
of its audit committee. Mr. Johnson serves as the chairman of
the board and president of the
United States Tennis Association, a non-profit corporation, and is on the compensation and
investment committees. Mr. Johnson also serves as a director and as chairman of the audit
committee of the UCLA Foundation, also a non-profit entity. The Board of Directors has determined
that Mr. Johnson is an independent director and that he qualifies as the financial expert of the
Audit Committee.
Mark V. Kaminski was appointed a director as of November 1, 2004. Mr. Kaminski was chief
executive officer and a director of Commonwealth Industries, Inc. (now Aleris International, Inc.)
from 1991 to June 2004, when he retired. Mr. Kaminski had served in other capacities with
Commonwealth Industries Inc. since 1987. Commonwealth Industries Inc. has been a supplier of
metals to Reliance, but the purchases in any year do not exceed five percent of either the gross
revenues or the total consolidated assets of the Company or of Commonwealth. Mr. Kaminski is also
a director of the Matthew Kelly Foundation, Cincinnati, Ohio, a non-profit organization. Mr.
Kaminski serves as a member and Chairman of our Nominating and Governance Committee and as a member
of the Compensation and Stock Option Committee. The Board of Directors has determined that Mr.
Kaminski is an independent director.
Gregg J. Mollins was appointed a director of Reliance in September 1997 and became President
of Reliance in January 2002. Mr. Mollins has served as Chief Operating Officer since May 1994.
Mr. Mollins was Executive Vice President from November 1995 to January 2002, was Vice President and
Chief Operating Officer from 1994 to 1995 and was Vice President from 1992 to 1994. Prior to that
time he had been with Reliance for six years as Division Manager of the Santa Clara division. For
ten years before joining Reliance in 1986, Mr. Mollins was employed by certain of our competitors
in various sales and sales management positions.
Richard
J. Slater is the president and a director of ORBIS L.L.C., an investment and advisory
firm, and is an advisor to the chairman and chief executive officer of Jacobs Engineering Group,
Inc., a New York Stock Exchange listed company that provides global technical professional
services. Mr. Slater served in various positions with Jacobs Engineering Group from 1980 to 2003,
most recently as Executive Vice President of Worldwide Operations. Mr. Slater serves as a member
of our Nominating and Governance Committee. The Board of Directors has determined that Mr. Slater
is an independent director.
Leslie A. Waite has been a director of Reliance since 1977. Mr. Waite is an investment
advisor and, since April 2003, has been Managing Director and Senior Portfolio Manager of
Valenzuela Capital Partners. Prior to that, he had been the president and chief portfolio manager
of Waite & Associates since its formation in 1977. Mr. Waite is a member of our Audit Committee
and serves as a member and Chairman of our Compensation and Stock Option Committee. The Board of
Directors has determined that Mr. Waite is an independent director.
Executive Officers
In addition to Messrs. Hannah and Mollins, the following are executive officers of Reliance:
Karla R. Lewis became Executive Vice President of Reliance in January 2002 and continues as
our Chief Financial Officer. Mrs. Lewis had been Senior Vice President and Chief Financial Officer
of Reliance since February 2000. Mrs. Lewis served as Vice President and Chief Financial Officer
of Reliance from 1999 to 2000 and was Vice President and Controller from 1995 to 1999. Mrs. Lewis
served as Corporate Controller from 1992 to 1995. For four years prior to joining Reliance, Mrs.
Lewis, a certified public accountant, was employed by Ernst & Young (our independent registered
public accounting firm) in various professional staff positions.
James P. MacBeth became Senior Vice President, Carbon Steel Operations in January 2002, having
been promoted from Vice President, Carbon Steel Operations, a position which he had held since July
1998. Prior to that time, Mr. MacBeth served as Division Manager of our Los Angeles Reliance Steel
Company division from September 1995 to June 1998. From December 1991 to September 1995, Mr.
MacBeth was Vice President and Division Manager of Feralloy Reliance Company, L.P., a joint venture owned 50% by Reliance. Prior to December 1991, Mr. MacBeth held various sales and
management positions since joining Reliance in 1969.
64
Table of Contents
William K. Sales, Jr. became Senior Vice President, Non-Ferrous Operations in January 2002,
having joined Reliance as Vice President, Non-Ferrous Operations in September 1997. From 1981 to
1997, Mr. Sales served in various sales and management positions with Kaiser Aluminum & Chemical
Corp., a producer of aluminum products and a supplier of Reliance.
Significant Employees
In addition, the following Reliance officers are expected to make significant contributions to
our operations:
Donna Newton, 52, became Vice President, Human Resources in January 2001. Ms. Newton joined
Reliance as Director of Employee Benefits and Human Resources in February 1999. Prior to that
time, she was director of sales and service for the Los Angeles office of Aetna U.S. Healthcare and
also held various management positions at Aetna over a 20-year period.
Kay Rustand, 58, joined Reliance as Vice President and General Counsel in January 2001. Prior
to that time, Ms. Rustand was a partner at the law firm of Arter & Hadden LLP (our former counsel)
in Los Angeles, California, for more than 10 years, specializing in corporate and securities law.
Following law school, Ms. Rustand served as a law clerk for the Honorable Herbert Y. C. Choy, of
the U. S. Court of Appeals, 9th Circuit.
Code of Ethics
Reliance has adopted a Code of Conduct, which includes a code of ethics, that applies to all
executive officers and senior management, including the Chief Executive Officer and the Executive
Vice President and Chief Financial Officer. Reliance has also adopted a Director Code of Conduct
that applies to all directors, whether management or non-management, independent or not. These
Codes of Conduct are posted on our website at www.rsac.com or a copy will be provided to
you at no charge if you request one in writing to the attention of the Secretary of the Company.
We have also established a confidential hotline to allow persons to report, without fear of
retaliation, any inappropriate acts or omissions relating to our financial statements and
accounting policies and practices.
Director Independence
Other than Messrs. Hannah and Mollins, who are officers and employees of the Company, the
Board has determined that no director has any material relationship with the Company nor is any
such director affiliated with any entity or person who has a material relationship with the
Company. Mr. Crider is a former chief executive officer of the Company, but he has been retired
for more than five years. Mr. Johnson is a former partner of Price Waterhouse, the predecessor to
the Company’s internal auditor, but he has been retired for more than five years, which was before
the Company retained PricewaterhouseCoopers. The Board has determined that, in light of the length
of time that Messrs. Crider and Johnson have been retired, their prior relationships are not
material to the determination of independence. Prior to his retirement, Mr. Kaminski served as
chief executive officer and a director of Commonwealth Industries Inc., which has been a supplier
of metals to Reliance. Since Reliance’s purchases from Commonwealth Industries Inc. in any year do
not exceed five percent of either the gross revenues or the total consolidated assets of Reliance
or of Commonwealth, the Board has determined that this prior relationship would not interfere with
Mr. Kaminski’s ability to exercise his independent judgment. Accordingly, the Board has determined
that all of the directors other than Messrs. Hannah and Mollins qualify as independent directors
under New York Stock Exchange Rule 303A. In making this determination, the Board reviewed and
considered information provided by the directors and the Company with regard to each director’s
business and personal activities as they may relate to the Company and to the Company’s management.
Reliance has provided our Annual Written Affirmation and Annual CEO Certification to the New
York Stock Exchange.
Section 16(a) Beneficial Ownership Reporting Compliance
Section 16(a) of the Securities Exchange Act of 1934, as amended, requires that our officers
and directors and any person who directly or indirectly is the beneficial owner of more than 10% of
our Common Stock must file reports of beneficial ownership and any changes in such ownership. The
three forms used for reports are: the Form 3, which is an initial statement of beneficial ownership
of such securities; the Form 4, which reports changes in beneficial ownership, and the Form 5,
which is an annual statement to report changes that have not previously been reported. Each of
these forms must be filed at specified times.
Based solely on our review of such forms and written representations made by certain of such
reporting persons, Reliance believes that during the year ended December 31, 2005, all persons have
complied with the requirements of Section 16(a).
65
Table of Contents
Item 11. Executive Compensation.
The following table summarizes certain information concerning the compensation that we paid
for the years 2005, 2004 and 2003 to our chief executive officer and each of the other four most
highly compensated executive officers whose aggregate salary and bonus exceeded $100,000 for
services rendered in all capacities to Reliance during 2005:
Summary Compensation Table
| Long Term Compensation | ||||||||||||||||||||||||||||
| Securities | ||||||||||||||||||||||||||||
| Restricted | Underlying | |||||||||||||||||||||||||||
| Name and | Annual Compensation | Stock | Options/ | All Other | ||||||||||||||||||||||||
| Principal Position | Year | Salary | Bonus(1) | Other(2) | Awards | SARs(#) | Compensation(3) | |||||||||||||||||||||
David H. Hannah |
2005 | $ | 560,000 | $ | 1,691,842 | $ | 1,012,700 | — | 100,000 | $ | 11,481 | |||||||||||||||||
Chief Executive Officer |
2004 | 525,000 | 931,112 | 227,400 | — | — | 11,331 | |||||||||||||||||||||
| 2003 | 500,000 | 575,297 | 370,800 | — | 30,000 | 10,615 | ||||||||||||||||||||||
Gregg J. Mollins |
2005 | $ | 425,000 | $ | 1,284,029 | $ | 513,300 | — | 75,000 | $ | 11,481 | |||||||||||||||||
President and Chief |
2004 | 400,000 | 708,508 | 636,650 | — | — | 11,331 | |||||||||||||||||||||
Operating Officer |
2003 | 375,000 | 476,737 | 326,700 | — | 30,000 | 10,615 | |||||||||||||||||||||
Karla R. Lewis |
2005 | $ | 300,000 | $ | 906,425 | $ | 752,900 | — | 75,000 | $ | 11,481 | |||||||||||||||||
Executive Vice President |
2004 | 250,000 | 442,883 | — | — | — | 11,331 | |||||||||||||||||||||
and Chief Financial
Officer |
2003 | 230,000 | 292,466 | 408,600 | — | 30,000 | 10,615 | |||||||||||||||||||||
James P. MacBeth |
2005 | $ | 275,000 | $ | 830,904 | $ | 465,000 | — | 50,000 | $ | 11,481 | |||||||||||||||||
Senior Vice President |
2004 | 225,000 | 342,362 | — | — | — | 11,331 | |||||||||||||||||||||
Carbon Steel Operations |
2003 | 200,000 | 224,341 | 371,621 | — | 25,000 | 10,615 | |||||||||||||||||||||
William K. Sales, Jr. |
2005 | $ | 275,000 | $ | 830,904 | $ | 465,000 | — | 50,000 | $ | 11,481 | |||||||||||||||||
Senior Vice President |
2004 | 225,000 | 342,362 | — | — | — | 11,331 | |||||||||||||||||||||
Non-Ferrous Operations |
2003 | 200,000 | 224,341 | 345,056 | — | 25,000 | 10,615 | |||||||||||||||||||||
| (1) | The amounts shown were paid under our Key-Man Incentive Plan and also include holiday bonuses. | |
| (2) | The amounts represent the difference between the exercise price and fair market value at date of exercise of non-qualified stock options. See “Aggregated Options/SAR Exercises in Last Fiscal Year and FY-End Option/SAR Values”. | |
| (3) | The amounts represent allocations to the accounts of each of the named executive officers of contributions made to our ESOP and the amount that represents our matching contribution to our 401(k) savings plan. |
During the fiscal years ended December 31, 2005 and 2003, non-qualified stock options for
350,000 and 140,000 shares, respectively, of our Common Stock were granted to the executive
officers named in the previous table. No shares were granted in 2004. The following table sets
forth information for the executive officers named above with regard to stock options granted
during the year ended December 31, 2005:
Options and Stock Appreciation Rights
Granted During Last Fiscal Year
Granted During Last Fiscal Year
| Percent of | Potential Realizable Value | |||||||||||||||||||||||
| Total | At Assumed Annual Rates | |||||||||||||||||||||||
| Number | Employee | Per Share | of Stock Price Appreciation | |||||||||||||||||||||
| of | Options | Exercise | Expiration | for Option Term | ||||||||||||||||||||
| Name | Shares | Granted | Price | Date | 5% | 10% | ||||||||||||||||||
David H. Hannah |
100,000 | 10.1 | % | $ | 49.15 | 10/18/10 | $ | 1,357,924 | $ | 3,000,657 | ||||||||||||||
Gregg J. Mollins |
75,000 | 7.6 | % | $ | 49.15 | 10/18/10 | $ | 1,018,443 | $ | 2,250,492 | ||||||||||||||
Karla R. Lewis |
75,000 | 7.6 | % | $ | 49.15 | 10/18/10 | $ | 1,018,443 | $ | 2,250,492 | ||||||||||||||
James P. MacBeth |
50,000 | 5.0 | % | $ | 49.15 | 10/18/10 | $ | 678,962 | $ | 1,500,328 | ||||||||||||||
William K. Sales, Jr. |
50,000 | 5.0 | % | $ | 49.15 | 10/18/10 | $ | 678,962 | $ | 1,500,328 | ||||||||||||||
The following table sets forth information for the executive officers named above with
regard to the aggregate stock options exercised during the year ended December 31, 2005, and the
stock options held as of December 31, 2005:
66
Table of Contents
Aggregated Options/SAR Exercises in Last Fiscal Year
and FY-End Option/SAR Values
and FY-End Option/SAR Values
| Number of Securities | Value of Unexercised | |||||||||||||||
| Underlying | In-the-Money | |||||||||||||||
| Unexercised Options/ | Options/SARs | |||||||||||||||
| Shares Acquired | Value | SARs at FY-End(#) | at FY-End($)(1) | |||||||||||||
| Name | on Exercise(#) | Realized($)(1) | Exercisable/Unexercisable | Exercisable/Unexercisable | ||||||||||||
David H. Hannah |
52,500 | $ | 1,012,700 | 7,500/120,000 | $ | 270,300/$1,915,200 | ||||||||||
Gregg J. Mollins |
27,500 | $ | 513,300 | 7,500/95,000 | $ | 270,300/$1,615,950 | ||||||||||
Karla R. Lewis |
40,000 | $ | 752,900 | 20,000/95,000 | $ | 718,200/$1,615,950 | ||||||||||
James P. MacBeth |
25,000 | $ | 465,000 | 12,500/67,500 | $ | 450,500/$1,226,600 | ||||||||||
William K. Sales, Jr. |
25,000 | $ | 465,000 | 12,500/67,500 | $ | 450,500/$1,226,600 | ||||||||||
| (1) | The value of the shares as of December 31, 2005 was based on the composite closing price on the New York Stock Exchange for that date or at the date of exercise. |
Stock Option Plans
In 1994, the Reliance Board of Directors adopted an Incentive and Non-Qualified Stock Option
Plan (the “1994 Plan”), which was approved by the shareholders in May 1994. In May 2001, the
shareholders approved an amendment to the 1994 Plan to increase the number of authorized shares
under the 1994 Plan to allow options to be granted for a maximum of 2,500,000 shares. As of
December 31, 2005, there were 524,000 options to acquire shares of Common Stock outstanding under
the 1994 Plan. The 1994 Plan provided for granting of stock options that may be either “Incentive
Stock Options” within the meaning of Section 422A of the Internal Revenue Code of 1986 (the “Code”)
or “Non-Qualified Stock Options” which do not satisfy the provisions of Section 422A of the Code.
Incentive Stock Options are required to be issued at an option exercise price per share equal to at
least the fair market value of a share of Common Stock on the date of grant, except that the
exercise price of options granted to any employee who owns (or, under pertinent Code provisions, is
deemed to own) more than 10% of the outstanding Common Stock must equal at least 110% of fair
market value on the date of grant. Non-Qualified Stock Options must be issued at an option
exercise price equal to at least fair market value on the date of grant. The Compensation and
Stock Option Committee established the terms and conditions for the exercise of stock options,
which are set forth in the instrument evidencing the stock option. Stock options may be exercised
with either cash or shares of our Common Stock or other form of payment authorized by the
Compensation and Stock Option Committee. Stock options expire five years from the date of the
grant. The 1994 Plan expired by its terms as of December 31, 2003, but the outstanding options
remain exercisable in accordance with their terms.
In 2003, we issued options to acquire an aggregate of 718,000 shares of our Common Stock at
$25.08 per share to key employees, of which 140,000 options were issued to named executive
officers. In 2003, options to acquire 423,375 shares of our Common Stock were exercised at prices
ranging from $18.83 to $25.60 per share, 177,750 of which were exercised by the named executive
officers. In 2004, options to acquire 367,800 shares were exercised at prices ranging from $18.83
to $25.60 per share, 85,000 of which were exercised by the named executive officers. In 2005,
options to acquire 425,950 shares of our Common Stock were exercised at prices ranging from $22.00
to $25.60 per share, 170,000 of which were exercised by the named executive officers.
In 2004, the Reliance Board of Directors adopted an Incentive and Non-Qualified Stock Option
Plan, which was approved by the shareholders in May 2004 (the “2004 Plan”). The Board reserved
3,000,000 shares of our Common Stock for issuance under the 2004 Plan. As of December 31, 2005,
there were 992,500 options to acquire shares of Common Stock outstanding under the 2004 Plan. The
2004 Plan provides for granting of stock options that may be either “Incentive Stock Options”
within the meaning of Section 422A of the Code or “Non-Qualified Stock Options” which do not
satisfy the provisions of Section 422A of the Code. Incentive Stock Options are required to be
issued at an option exercise price per share equal to at least the fair market value of a share of
Common Stock on the date of grant, except that the exercise price of options granted to any
employee who owns (or, under pertinent Code provisions, is deemed to own) more than 10% of the
outstanding Common Stock must equal at least 110% of fair market value on the date of grant.
Non-Qualified Stock Options must be issued at an option exercise price equal to at least fair
market value on the date of grant. The Compensation and Stock Option Committee establishes the
terms and conditions for the exercise of stock options, which are set forth in the instrument
evidencing the stock option. Stock options may be exercised with cash or such other form of payment
as may be authorized by the Compensation and Stock Option Committee. Stock options may not be
granted more than ten years from the date of the 2004 Plan and expire five years from the date of
the grant. The 2004 Plan expires by its terms as of December 31, 2013.
67
Table of Contents
In October 2005, under the 2004 Plan, we issued options to acquire an aggregate of 992,500
shares of our Common Stock at $49.15 per share to key employees, of which 350,000 were issued to
named executive officers.
In May 1998, the shareholders approved the Directors Stock Option Plan for non-employee
directors. There were 300,000 shares of our Common Stock reserved for issuance under the Directors
Plan initially. In February 1999, the Directors Plan was amended to authorize the Board of
Directors of Reliance to grant additional options to acquire our Common Stock to non-employee
directors. In May 2004, the Directors Plan was amended to accelerate the vesting of a non-employee
director’s unexpired stock options in the event that such an individual retires from the Board of
Directors at or after the age of 75, so that any unexpired stock options granted under the
Directors Plan become immediately vested and exercisable, and the director, if he or she so
desires, must exercise those options within ninety (90) days after such retirement or the options
shall expire automatically. Options under the Directors Plan are non-qualified stock options, with
an exercise price equal to fair market value at the date of grant. All options granted prior to
May 2005 expire five years from the date of grant. None of the stock options become exercisable
until one year after the date of the grant, unless specifically approved by the Board of Directors.
In each of the following four years, 25% of the options become exercisable on a cumulative basis.
In May 2005 the Directors Plan was further amended to provide for automatic annual grants of
options to acquire 3,000 shares of Common Stock to each non-employee director. These options become
100% exercisable after one year. Once exercisable, the options remain exercisable until that date
which is ten years after the date of grant. In addition, the amendment increased the number of
shares available for future grants of options from the 187,000 shares reserved as of May 2005 to
250,000 shares. As of December 31, 2005, there were 63,000 options to acquire shares of Common
Stock outstanding under the Directors Plan and 179,500 authorized shares available under the
Directors Plan for future grants.
In May 2003, options to purchase 37,500 shares of our Common Stock at $17.11 per share were
automatically granted under the Directors Plan. In 2004 options to acquire 22,500 shares of our
Common Stock at prices ranging from $30.81 to $34.32 per share were automatically granted under the
Directors Plan. In May 2005, options to acquire 18,000 shares of our Common Stock at $36.62 per
share were automatically granted under the Directors Plan. In 2003, options to acquire 36,000
shares of our Common Stock were exercised at prices ranging from $18.04 to $18.83 per share. In
2004, options to acquire 69,000 shares of our Common Stock were exercised at prices ranging from
$17.11 to $18.83 per share. In 2005, options to acquire 7,500 shares of our common Stock were
exercised at a price of $17.11 per share.
401(k) Savings Plan
Various 401(k) and profit sharing plans are maintained by Reliance and its subsidiaries.
Effective in 1998, the Reliance Steel & Aluminum Co. Master 401(k) Plan (the “Master Plan”) was
established, which combined several of the various 401(k) and profit sharing plans of Reliance and
its subsidiaries into one plan. Salaried and certain hourly employees of Reliance and its
participating subsidiaries are covered under the Master Plan. The Master Plan will continue to
allow each subsidiary’s Board to determine independently the annual matching percentage and maximum
compensation limits or annual profit sharing contribution. Eligibility occurs after three months
of service, and the Reliance contribution vests at 25% per year, commencing one year after the
employee enters the Master Plan. Reliance’s contributions to the Master Plan for the years ended
December 31, 2005, 2004 and 2003 were $7,035,000, $6,241,000 and $4,528,000, respectively. Other
401(k) and profit sharing plans and defined benefit pension plans exist as certain subsidiaries
have not yet combined their plans into the Master Plan as of December 31, 2005. One of these
defined benefit pension plans was terminated effective December 31, 2004 and distributions to
participants will be made in 2006.
Reliance also participates in various multi-employer pension plans covering certain employees
not covered under our benefit plans pursuant to agreements between Reliance and collective
bargaining units who are members of such plans.
Supplemental Executive Retirement Plan
In 1996, Reliance adopted a Supplemental Executive Retirement Plan (“SERP”), which provides
post-retirement benefits to key officers of Reliance. Under the SERP, benefit payments equal 50%
of the average of the participant’s highest five years of the last ten years of total cash
compensation, less benefits from other retirement plans that we sponsor, including the 401(k) Plan
and ESOP. The SERP was amended in 1999 to provide for a pre-retirement death benefit. Separate
SERP’s existed for two of the companies we acquired, which continue to provide post-retirement
benefits to certain key employees of each company who were eligible to participate in the plans at
the time we acquired the companies. Reliance expenses were $1,632,000, $1,498,000 and $1,696,000
for the plans for the years ended December 31, 2005, 2004, and 2003, respectively, based on
calculations made by our actuaries.
68
Table of Contents
The estimated present value of annual benefits payable by the SERP, net of amounts received
under other retirement plans that we sponsor, at the normal retirement age of 65 for each of the executive officers named
above is as follows:
| Estimated Annual Benefits | ||||
| Name | Payable Upon Retirement | |||
David H. Hannah |
$ | 487,385 | ||
Gregg J. Mollins |
$ | 402,406 | ||
Karla R. Lewis |
$ | 242,521 | ||
James P. MacBeth |
$ | 208,858 | ||
William K. Sales, Jr. |
$ | 230,870 | ||
Incentive Plan
We have maintained a Key-Man Incentive Plan for our division managers and corporate officers
since 1965, with subsequent amendments. Most recently, we modified the Key-Man Incentive Plan in
January 1999, to more accurately reflect the conditions of Reliance and the industry, and to
allocate the incentive bonus pool in accordance with the contributions of the eligible personnel.
The initial incentive bonus pool is calculated to equal 20% of the amount by which our net income
for that year exceeds the rate of return on a one-year Treasury bill multiplied by our net worth at
the beginning of the year. That pool is then adjusted by additional calculations, including the
accrual of the calculated incentives. Our corporate officers and certain division managers are
eligible to participate in the pool and our division managers are ranked according to certain
criteria and awarded points based on their rankings. The incentive compensation bonus is payable
75% in cash and 25% in our Common Stock, except that Corporate officers have the option of having
this bonus paid 100% in cash. The Company has reserved 87,098 shares of Common Stock for issuance
as restricted stock under this Plan as of December 31, 2005. Officers of the subsidiaries are not
currently eligible to participate under the Key-Man Incentive Plan.
Employee Stock Ownership Plan
In 1974, Reliance adopted an Employee Stock Ownership Plan (“ESOP”) that was approved by the
Internal Revenue Service as a qualified plan and that allows eligible employees to receive our
Common Stock. Union Bank of California is the ESOP trustee. All non-union employees, including
officers, are eligible to participate in the ESOP as of January 1 after one and one-half year’s of
service with Reliance. An employee who is eligible to participate is fully vested in the shares of
our Common Stock allocated to his/her ESOP account. Allocation is based on the participant’s
compensation each year, including bonuses, as compared to the total compensation of all
participants, subject to the maximum amounts established by the Internal Revenue Service. Each
year, Reliance contributes to the ESOP an amount determined by the Board of Directors, but no less
than that amount necessary to cover the obligations of the ESOP, including any trustee’s fees. Our
cash contributions were $1,000,000 in each of 2005 and 2004, and $800,000 in 2003. The cash
contributions are then used to purchase shares of our Common Stock on the open market. The shares
are retained by the ESOP until a participant retires or otherwise terminates his/her employment
with Reliance. Employees of the subsidiaries, except for RSAC Management Corp., are not eligible
to participate under our ESOP.
69
Table of Contents
Performance Graph
The following graph compares the performance of our Common Stock with that of the S&P 500, the
Russell 2000 and two peer groups that we selected for the five-year period from December 31, 2000
through December 31, 2005. The comparison of total return assumes that a fixed investment of $100
was invested on December 31, 2000 in our Common Stock and assumes the reinvestment of dividends.
Since there is no nationally-recognized industry index consisting of metals service center
companies to be used as a peer group index, Reliance constructed its own peer group. The peer
group originally consisted of Steel Technologies Inc., Olympic Steel Inc. and
Gibraltar Steel Corporation, all of which have securities listed for trading on NASDAQ; A.M. Castle
& Co., which has securities listed for trading on the American Stock Exchange; and Ryerson Inc. and
Worthington Industries, Inc. which have securities listed for trading on the New York Stock
Exchange, as of December 31, 2005 and Metals USA, Inc. (collectively, “Old Peer Group”). This year we have added Earle
M. Jorgensen Company to the peer group, which has securities listed for trading on the New York
Stock Exchange and removed Metals USA, Inc. from the peer group because it is no longer a public
company (Old Peer Group together with Earle M. Jorgensen and excluding Metals USA, “New Peer
Group”). We believe that these changes better reflect our competitive market. We show the
comparison for both groups below. The returns of each member of the peer groups are weighted
according to that member’s stock market capitalization as of the period measured. The stock price
performance shown on the graph below is not necessarily indicative of future price performance.
Comparison of Five Year Cumulative Total Return*
Among Reliance Steel & Aluminum Co., The S&P 500 Index,
The Russell 2000 Index and Two Peer Groups
Among Reliance Steel & Aluminum Co., The S&P 500 Index,
The Russell 2000 Index and Two Peer Groups
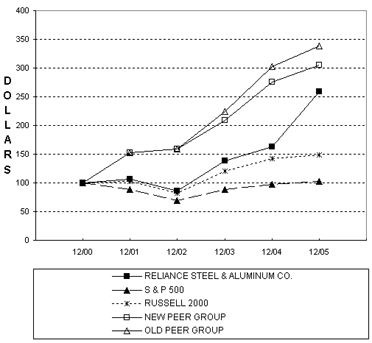
Cumulative Total Return
| 12/00 | 12/01 | 12/02 | 12/03 | 12/04 | 12/05 | |||||||||||||||||||
Reliance Steel & Aluminum Co. |
100 | 107 | 86 | 138 | 163 | 258 | ||||||||||||||||||
Old Peer Group |
100 | 152 | 158 | 224 | 303 | 338 | ||||||||||||||||||
New Peer Group |
100 | 152 | 158 | 209 | 276 | 305 | ||||||||||||||||||
S&P500 |
100 | 88 | 69 | 88 | 98 | 103 | ||||||||||||||||||
Russell 2000 |
100 | 102 | 81 | 120 | 142 | 148 | ||||||||||||||||||
| * | $100 Invested on December 31, 2000 in stock or index – including reinvestment of dividends. Fiscal year ending December 31. |
70
Table of Contents
Item 12. Security Ownership of Certain Beneficial Owners and Management.
The following table sets forth certain information as of January 31, 2006, with respect to the
beneficial ownership of our Common Stock by (i) each person known to Reliance who owns beneficially
or of record more than five percent (5%) of the Common Stock of Reliance, (ii) each director and
each executive officer named in the Summary Compensation Table and (iii) all directors and
executive officers as a group:
| Amount and | ||||||||
| Nature of | Percentage of | |||||||
| Name and Address | Beneficial | Outstanding | ||||||
| of Beneficial Owner(1) | Ownership(2) | Shares Owned | ||||||
Florence A. Neilan |
4,198,090 | 12.67 | % | |||||
2888 Bayshore Dr., Apt. A-12 Newport Beach, CA 92663 |
||||||||
Barclays Global Investors, NA |
2,625,135 | (3) | 7.92 | % | ||||
45 Fremont Street San Francisco, CA 94105 |
||||||||
Franklin Resources, Inc. |
1,767,800 | (4) | 5.34 | % | ||||
One Franklin Parkway San Mateo, CA 94403 |
||||||||
Dimensional Fund Advisors Inc. |
1,737,577 | (5) | 5.24 | % | ||||
1299 Ocean Avenue, 11th Floor Santa Monica, CA 90401 |
||||||||
Joe D. Crider |
101,875 | (6) | * | |||||
400 A Mariposa Sierra Madre, CA 91024 |
||||||||
Thomas W. Gimbel |
342,118 | (7) | 1.03 | % | ||||
P.O. Box 50270 Pasadena, CA 91115 |
||||||||
David H. Hannah |
122,788 | (8) | * | |||||
Douglas M. Hayes |
8,000 | (9) | * | |||||
2545 Roscomare Rd. Los Angeles, CA 90077 |
||||||||
Franklin R. Johnson |
6,625 | (10) | * | |||||
350 South Grand Avenue, Suite 4800 Los Angeles, CA 90071 |
||||||||
Mark V. Kaminski |
4,906 | (11) | * | |||||
3521 Winterberry Circle Louisville, KY 40207 |
||||||||
Gregg J. Mollins |
75,571 | (12) | * | |||||
Richard J. Slater |
— | * | ||||||
1235 Hillcrest Avenue Pasadena, CA 91106 |
||||||||
Leslie A. Waite |
74,406 | (13) | * | |||||
55 South Lake Street, Suite 750 Pasadena, CA 91101 |
||||||||
Karla R. Lewis |
59,968 | (14) | * | |||||
James P. MacBeth |
44,848 | (15) | * | |||||
William K. Sales, Jr. |
24,379 | (16) | * | |||||
All directors and executive officers as a group
(12 persons) |
865,484 | (17) | 2.60 | % | ||||
| * | Less than 1%. | |
| (1) | Unless otherwise indicated, the address of each beneficial owner is 350 South Grand Avenue, Suite 5100, Los Angeles, California 90071. | |
| (2) | Reliance has been advised that the named shareholders have the sole power to vote and to dispose of the shares set forth after their names, except as noted. | |
| (3) | A Schedule 13G was filed in January 2006 on behalf of Barclays Global Investors, NA, Barclays Global Fund Advisors, Barclays Global Investors, LTD and Barclays Global Investors Japan Trust and Banking Company Limited; all of which banks disclaim beneficial ownership of the shares and which report that the securities are held in trust accounts and beneficially owned by one of more beneficiaries of those accounts. Of the reported shares, 1,914,480 shares are owned by Barclays Global Fund Investors, NA and 710,655 shares are owned by Barclays Global Fund Advisors. | |
| (4) | A Schedule 13G was filed in February 2006 on behalf of Franklin Resources, Inc., parent holding company; Charles B. Johnson, principal shareholder of parent holding company; and Rupert H. Johnson, Jr., principal shareholder of parent holding company; all of which disclaim beneficial ownership of the shares and which report that the securities are beneficially owned by one or more open or closed-end investment companies or other managed accounts which are advised by direct and indirect investment advisory subsidiaries of Franklin Resources, Inc. | |
| (5) | A Schedule 13G was filed in February 2006 on behalf of Dimensional Fund Advisors Inc., which reports that it is a registered investment advisor that furnishes investment advice to four investment companies and serves as investment manager to certain other commingled group trusts and separate accounts. Dimensional Fund Advisors Inc. disclaims beneficial ownership of the shares and reports that the securities are owned by advisory clients of Dimensional Fund Advisors Inc., no one of which owns more than 5% of the class. |
71
Table of Contents
| (6) | Includes 1,875 shares issuable upon the exercise of options held by Mr. Crider with an exercise price of $30.81 per share. All shares are held by Mr. Crider as a Co-Trustee of the Crider Family Trust with his wife. | |
| (7) | Includes 3,750 shares issuable upon the exercise of options held by Mr. Gimbel, with an exercise price of $31.24 per share. Includes 13,750 shares that are owned jointly with Mr. Gimbel’s wife. Excludes 10,600 shares that are held in trusts, for which Mr. Gimbel is the Trustee, for the benefit of Mr. Gimbel’s children, as to which he disclaims beneficial ownership. | |
| (8) | Includes 12,500 shares issuable upon the exercise of options held by Mr. Hannah, with exercise prices of $25.08 to $25.60 per share. All of the shares are owned jointly with Mr. Hannah’s wife. Excludes 13,447 shares with respect to which Mr. Hannah has a vested right and shared voting power pursuant to our Employee Stock Ownership Plan (“ESOP”). | |
| (9) | Includes 3,750 shares issuable upon the exercise of options held by Mr. Hayes, with an exercise price of $17.11 per share. | |
| (10) | Includes 5,625 shares issuable upon the exercise of options held by Mr. Johnson, with an exercise price of $26.39 per share. | |
| (11) | Includes 1,875 shares issuable upon the exercise of options held by Mr. Kaminski with an exercise price of $34.32 per share | |
| (12) | Includes 12,500 shares issuable upon the exercise of options held by Mr. Mollins with exercise prices of $25.08 to $25.60 per share. All of the shares are owned jointly with Mr. Mollins’ wife. Excludes 5,762 shares with respect to which Mr. Mollins has a vested right and shared voting power pursuant to our ESOP. | |
| (13) | Includes 3,750 shares issuable upon the exercise of options held by Mr. Waite, with an exercise price of $17.11 per share. | |
| (14) | Includes 25,000 shares issuable upon the exercise of options held by Mrs. Lewis, with exercise prices of $25.08 to $25.60 per share. Excludes 2,315 shares with respect to which Mrs. Lewis has a vested right and shared voting power pursuant to our ESOP. | |
| (15) | Includes 17,500 shares issuable upon the exercise of options held by Mr. MacBeth, with exercise prices of $25.08 to $25.60 per share. Excludes 5,271 shares with respect to which Mr. MacBeth has a vested right and shared voting power pursuant to our ESOP. | |
| (16) | Includes 17,500 shares issuable upon the exercise of options held by Mr. Sales, with exercise prices of $25.08 to $25.60 per share. Excludes 804 shares with respect to which Mr. Sales has a vested right and shared voting power pursuant to our ESOP. | |
| (17) | See notes 6 through 16. |
The following table sets forth certain information regarding the 1994 Plan, the 2004
Plan and the Directors Plan as of December 31, 2005:
Equity Compensation Table
| Number of Securities to | Weighted Average | |||||||||||
| be Issued upon Exercise | Exercise Price of | Number of Securities | ||||||||||
| of Outstanding Options, | Outstanding Options, | Remaining Available | ||||||||||
| Plan Category | Warrants and Rights | Warrants and Rights | for Future Issuance | |||||||||
Equity compensation
plans approved by
security holders |
1,579,500 | $ | 40.40 | 2,187,000 | ||||||||
Equity compensation
plans not approved
by security holders |
— | — | — | |||||||||
Total |
1,579,500 | $ | 40.40 | 2,187,000 | ||||||||
The
Company also issues restricted stock to key employees under its Key-Man Incentive
Plan. There are 87,098 shares of the Company’s Common Stock currently reserved for issuance as
restricted stock under the Company’s Key-Man Incentive Plan. See “Incentive Plan” in Item 11.
72
Table of Contents
Item 13. Certain Relationships and Related Transactions.
In addition to a provision authorizing the indemnification of directors, our Restated Articles
of Incorporation limit or eliminate the personal liability of directors for monetary damages to
Reliance or its shareholders for the breach of fiduciary duty as a director in accordance with
California corporate law. This provision does not limit or eliminate the liability of a director
for the following: (i) for acts or omissions that involve intentional misconduct or a knowing and
culpable violation of law; (ii) for acts or omissions that a director believes to be contrary to
the best interests of the corporation or its shareholders, or that involve the absence of good
faith on the part of the director; (iii) for any transaction from which a director derived an
improper personal benefit; (iv) for acts or omissions that show a reckless disregard of the
director’s duty to the corporation or its shareholders in circumstances in which the director was
aware, or should have been aware, in the ordinary course of performing a director’s duties, of a
risk of serious injury to the corporation or its shareholders; (v) for acts or omissions that
constitute an unexcused pattern of inattention that amounts to an abdication of the director’s duty to the corporation
or its shareholders; (vi) for transactions between the corporation and a director, or between
corporations having interrelated directors; and (vii) for improper distributions and stock
dividends, loans and guaranties. The provisions of the Indemnification Agreements described below
will be available to directors in the event of claims made against a director for certain types of
liability which are not eliminated in the Restated Articles of Incorporation.
Our Bylaws require Reliance to indemnify officers, directors, employees and agents to the
fullest extent permissible by California Corporations Code Section 317 against expenses, judgments,
fines, settlements or other amounts actually and reasonably incurred by that person as a result of
being made or threatened to be made a party to a proceeding. Reliance has entered into
indemnification agreements with all of its present directors and all of its officers, to indemnify
these persons against certain liabilities. The form of these Indemnification Agreements was
approved by the Board of Directors and shareholders of Reliance in March 1988, and the shareholders
also authorized the Board of Directors to enter into Indemnification Agreements with all existing
and future directors at the time they are so elected and to determine, from time to time, whether
similar Indemnification Agreements should be entered into with other individual officers who are
not directors. The Indemnification Agreements provide for indemnification in cases where
indemnification might not otherwise be available in the absence of the Indemnification Agreements
under our Restated Articles of Incorporation.
Each Indemnification Agreement provides that Reliance will indemnify the indemnitee and hold
him or her harmless, to the fullest extent permitted by law, from all amounts which he or she pays
or is obligated to pay as a result of claims against him or her arising out of his or her service
to Reliance, including derivative claims by or in the right of Reliance. Reliance has agreed to
indemnify against the amounts of all damages, judgments, sums paid in settlement (if approved by
Reliance, which approval will not be unreasonably withheld), counsel fees, costs of proceedings or
appeals, and fines and penalties (other than fines and penalties for which indemnification is not
permitted by applicable law) within the scope of the indemnification.
In addition, Reliance has purchased directors and officers liability insurance for the benefit
of its directors and officers.
73
Table of Contents
Item 14. Principal Accountant Fees and Services.
Ernst & Young LLP has acted as our independent auditors for more than sixty-five years. The
Audit Committee and the Board of Directors selected, and our shareholders approved, Ernst & Young
LLP to serve as the independent registered public accounting firm for the Company to perform the
annual audit of our 2005 financial statements. We paid our independent registered public
accounting firm the amounts set forth in the tables below for services provided in the last two
years. Audit fees are the aggregate fees for services of the independent registered public
accounting firm for audits of our annual financial statements, the audit of management’s assessment
of internal control over financial reporting and the independent registered accounting firm’s own
audit of our internal control over financial reporting, including testing and compliance with
Section 404 of the Sarbanes-Oxley Act, and review of our quarterly financial statements included in
our Forms 10-Q, and services that are normally provided by the independent registered public
accounting firm in connection with statutory and regulatory filings or engagements for those fiscal
years. This category also includes advice on accounting matters that arose during, or as a result
of, the audit or review of interim financial statements, statutory audits required by non-U.S.
jurisdictions and the preparation of an annual “management letter” on internal control matters.
Audit-related fees are those fees for services provided by the independent registered public
accounting firm that are reasonably related to the performance of the audit or review of our
financial statements and not included as audit fees. Our audit-related fees were paid for
accounting consultations, benefit plan audits, due diligence reviews in connection with potential
acquisition targets, certain of which were completed, and reviews of our various regulatory
filings. We paid tax fees for tax advice, planning and compliance, principally in connection with
the preparation of our tax returns, and assistance related to our election of Section 338(h)(10)
treatment for certain of our acquisitions and assistance with certain governmental tax audits.
Audit Fees
2005 |
$ | 1,923,000 | ||
2004 |
$ | 1,891,000 |
Audit-Related Fees
2005 |
$ | 125,000 | ||
2004 |
$ | 128,000 |
Tax Fees
2005 |
$ | 667,000 | ||
2004 |
$ | 714,000 |
All Other Fees
2005 |
$ | -0- | ||
2004 |
$ | -0- |
The Audit Committee approved all of these fees. The Audit Committee has adopted a Pre-Approval
Policy that requires that the Audit Committee approve in advance the engagement letter and all
audit fees set forth in such letter for the independent auditor. In addition, the Audit Committee
will review proposed audit, audit-related, tax and other services that management desires the
independent registered accounting firm to perform to ensure that such services and the proposed
fees related to the services will not impair the independent registered public accounting firm’s
independence and that such services and fees are consistent with the rules established by the
Securities and Exchange Commission. Each quarter the Chief Financial Officer of the Company
reports to the Audit Committee what services have been performed and what fees incurred. The Audit
Committee has delegated to the Chairman of the Audit Committee the authority to add to, amend or
modify the list of services to be provided or the amount of fees to be paid; provided that the
Chairman will report any action taken to the Audit Committee at its next scheduled meeting and
provided further that the fees involved are reasonably expected to be less than $100,000.
74
Table of Contents
PART IV
Item 15. Exhibits, Financial Statement Schedules.
(a) The following documents are filed as part of this report:
(1) Financial Statements (included in Item 8).
Report of Independent Registered Public Accounting Firm
Consolidated Balance Sheets at December 31, 2005 and 2004
Consolidated Statements of Income for the Years Ended December 31, 2005, 2004 and 2003
Consolidated Statements of Shareholders’ Equity for the Years Ended December 31, 2005,
2004 and 2003
Consolidated Statements of Cash Flows for the Years Ended December 31, 2005, 2004 and
2003
Notes to Consolidated Statements
Quarterly Results of Operations (Unaudited) for the Years Ended December 31, 2005, 2004
and 2003
(2) Financial Statement Schedules
Schedule II
— Valuation and Qualifying Accounts
All other schedules have been omitted since the required information is not significant or is
included in the Consolidated Financial Statements or notes thereto or is not applicable.
(3) Exhibits
| 2.01 | Agreement and Plan of Merger dated as of January 17, 2006, among Reliance Steel & Aluminum Co., RSAC Acquisition Corp. and Earle M. Jorgensen Company(1) | ||
| 3.01 | Registrant’s Restated Articles of Incorporation(2) | ||
| 3.02 | Registrant’s Amended and Restated Bylaws(2) | ||
| 3.03 | Amendment to Registrant’s Restated Articles of Incorporation dated May 20, 1998(3) | ||
| 4.01 | Registration Rights Agreement dated as of January 17, 2006, among Reliance Steel & Aluminum Co. and each of the stockholders of Earle M. Jorgensen Company named therein(1) | ||
| 10.01 | Registrant’s 1994 Incentive and Non-Qualified Stock Option Plan and the Forms of Agreements related thereto, as amended(2) | ||
| 10.02 | Registrant’s Form of Indemnification Agreement for officers and directors(2) | ||
| 10.03 | Incentive Bonus Plan(2) | ||
| 10.04 | Registrant’s Supplemental Executive Retirement Plan dated January 1, 1996(4) | ||
| 10.05 | Registrant’s Directors Stock Option Plan dated May 20, 1998(3) | ||
| 10.06 | Credit Agreement dated October 24, 2001(5) | ||
| 10.07 | Amendment No. One to Credit Agreement dated October 24, 2001(6) | ||
| 10.08 | Amendment No. Two to Credit Agreement dated October 24, 2001(7) | ||
| 10.09 | Amendment No. Three to Credit Agreement dated October 24, 2001(8) | ||
| 10.10 | Amendment No. Four to Credit Agreement dated October 24, 2001(9) | ||
| 10.11 | Form of Note Purchase Agreement dated as of July 1, 2003 by and between the Registrant and each of the Purchasers listed on the Schedule thereto(8) | ||
| 10.12 | Registrant’s 2004 Incentive and Non-Qualified Stock Option Plan(10) | ||
| 10.13 | Amendment No. 2 to Registrant’s Directors Stock Option Plan(10) | ||
| 10.14 | Registrant’s Amended and Restated Directors Stock Option Plan(11) | ||
| 10.15 | Credit Agreement dated June 13, 2005(12) | ||
| 10.16 | Omnibus Amendment to Note Purchase Agreements(12) | ||
| 10.17 | Voting Agreement dated as of January 17, 2006 among Reliance Steel & Aluminum Co. and each of the stockholders of Earle M. Jorgensen Company named therein(1) | ||
| 14.01 | Registrant’s Code of Conduct | ||
| 21 | Subsidiaries of Registrant | ||
| 23 | Consent of Ernst & Young LLP | ||
| 24 | Power of Attorney(13) | ||
| 31.1 | Certification of Chief Executive Officer pursuant to Rule 13a-14(a) and Rule 15d-14(a) of the Securities Exchange Act, as amended | ||
| 31.2 | Certification of Chief Financial Officer pursuant to Rule 13a-14(a) and Rule 15d-14(a) of the Securities Exchange Act, as amended | ||
| 32 | Certification of Chief Executive Officer and Chief Financial Officer Pursuant to 18 U.S.C. 1350, as adopted pursuant to Section 906 of the Sarbanes-Oxley Act of 2002 |
| (1) | Incorporated by reference from Exhibits 2.1, 4.1 and 10.1 to Registrant’s Registration Statement on Form S-4, as amended, originally filed on February 7, 2006 as Commission File No. 333-13625. | |
| (2) | Incorporated by reference from Exhibits 3.01, 3.02, 10.01, 10.02, 10.03 and 10.06, respectively, to Registrant’s Registration Statement on Form S-1, as amended, originally filed on May 25, 1994 as Commission File No. 33-79318. | |
| (3) | Incorporated by reference from Appendix A and Appendix B to Registrant’s Proxy Statement for Annual Meeting of Shareholders held May 20, 1998. | |
| (4) | Incorporated by reference from Exhibit 10.06 to Registrant’s Form 10-K, for the year ended December 31, 1996. | |
| (5) | Incorporated by reference from Exhibit 10.10 to Registrant’s Form 10-Q, for the quarter ended September 30, 2001. | |
| (6) | Incorporated by reference from Exhibit 10.11 to Registrant’s Form 10-K, for the year ended December 31, 2002. | |
| (7) | Incorporated by reference from Exhibit 10.1 to Registrant’s Form 8-K, filed on February 20, 2003. | |
| (8) | Incorporated by reference from Exhibit 2.2 to Registrant’s Form 8-K, filed on July 15, 2003. | |
| (9) | Incorporated by reference from Exhibit 10.1 to Registrant’s Form 8-K, filed on December 16, 2004. | |
| (10) | Incorporated by reference from Appendix A and Appendix B to Registrant’s Proxy Statement for Annual Meeting of Shareholders held May 19, 2004. |
75
Table of Contents
| (11) | Incorporated by reference from Appendix A to Registrant’s Proxy Statement for Annual Meeting of Shareholders held May 18, 2005. | |
| (12) | Incorporated by reference from Exhibit 10.1and 10.2 to Registrant’s Form 8-K, dated June 13, 2005. | |
| (13) | Set forth on page 77 of this report. |
76
Table of Contents
SIGNATURES
Pursuant to the requirements of Section 13 or 15(d) of the Securities Exchange Act of 1934, as
amended, the Registrant has duly caused this Annual Report on Form 10-K to be signed on its behalf
by the undersigned, thereunto duly authorized, in the City of Los Angeles, State of California, on
this 14th day of March, 2006.
| RELIANCE STEEL & ALUMINUM CO. |
||||
| By: | /s/ David H. Hannah | |||
| David H. Hannah | ||||
| Chief Executive Officer | ||||
POWER OF ATTORNEY
The officers and directors of Reliance Steel & Aluminum Co. whose signatures appear below
hereby constitute and appoint David H. Hannah and Gregg J. Mollins, or either of them, to act
severally as attorneys-in-fact and agents, with power of substitution and resubstitution, for each
of them in any and all capacities, to sign any amendments to this report and to file the same, with
exhibits thereto, and other documents in connection therewith, with the Securities and Exchange
Commission, hereby ratifying and confirming all that said attorneys-in-fact, or substitute or
substitutes, may do or cause to be done by virtue hereof.
Pursuant to the requirements of the Securities Exchange Act of 1934, as amended, this report
has been signed below by the following persons in the capacities and on the dates indicated.
| Signatures | Title | Date | ||||
/s/
|
DAVID H. HANNAH | Chief Executive Officer | ||||
| David H. Hannah | (Principal Executive Officer); Director | March 14, 2006 | ||||
/s/
|
GREGG J. MOLLINS | President and Chief Operating Officer; | ||||
| Gregg J. Mollins | Director | March 14, 2006 | ||||
/s/
|
KARLA LEWIS | Executive Vice President and Chief Financial Officer | March 14, 2006 | |||
| Karla Lewis | (Principal Financial Officer; Principal Accounting Officer) | |||||
/s/
|
JOE D. CRIDER | Chairman of the Board; Director | March 14, 2006 | |||
| Joe D. Crider | ||||||
/s/
|
THOMAS W. GIMBEL | Director | March 14, 2006 | |||
| Thomas W. Gimbel | ||||||
/s/
|
DOUGLAS M. HAYES | Director | March 14, 2006 | |||
| Douglas M. Hayes | ||||||
/s/
|
MARK V. KAMINSKI | Director | March 14, 2006 | |||
| Mark V. Kaminski | ||||||
/s/
|
FRANKLIN R. JOHNSON | Director | March 14, 2006 | |||
| Franklin R. Johnson | ||||||
/s/
|
RICHARD J. SLATER | Director | March 14, 2006 | |||
| Richard J. Slater | ||||||
/s/
|
LESLIE A. WAITE | Director | March 14, 2006 | |||
| Leslie A. Waite | ||||||
77
Table of Contents
EXHIBIT INDEX
| Sequentially | ||||
| Exhibit | Numbered | |||
| Number | Description | Page | ||
2.01
|
Agreement and Plan of Merger dated as of January 17, 2006, among Reliance Steel & Aluminum Co., RSAC Acquisition Corp. and Earle M. Jorgensen Company(1) | |||
3.01
|
Registrant’s Restated Articles of Incorporation(2) | |||
3.02
|
Registrant’s Amended and Restated Bylaws(2) | |||
3.03
|
Amendment to Registrant’s Restated Articles of Incorporation dated May 20, 1998(3) | |||
4.01
|
Registration Rights Agreement dated as of January 17, 2006, among Reliance Steel & Aluminum Co. and each of the stockholders of Earle M. Jorgensen Company named therein(1) | |||
10.01
|
Registrant’s 1994 Incentive and Non-Qualified Stock Option Plan and the Forms of Agreements related thereto, as amended(2) | |||
10.02
|
Registrant’s Form of Indemnification Agreement for officers and directors(2) | |||
10.03
|
Incentive Bonus Plan(2) | |||
10.04
|
Registrant’s Supplemental Executive Retirement Plan dated January 1, 1996(4) | |||
10.05
|
Registrant’s Directors Stock Option Plan dated May 20, 1998(3) | |||
10.06
|
Credit Agreement dated October 24, 2001(5) | |||
10.07
|
Amendment No. One to Credit Agreement dated October 24, 2001(6) | |||
10.08
|
Amendment No. Two to Credit Agreement dated October 24, 2001(7) | |||
10.09
|
Amendment No. Three to Credit Agreement dated October 24, 2001(8) | |||
10.10
|
Amendment No. Four to Credit Agreement dated October 24, 2001(9) | |||
10.11
|
Form of Note Purchase Agreement dated as of July 1, 2003 by and between the Registrant and each of the Purchasers listed on the Schedule thereto(8) | |||
10.12
|
Registrant’s 2004 Incentive and Non-Qualified Stock Option Plan(10) | |||
10.13
|
Amendment No. 2 to Registrant’s Directors Stock Option Plan(10) | |||
10.14
|
Registrant’s Amended and Restated Directors Stock Option Plan(11) | |||
10.15
|
Credit Agreement dated June 13, 2005(12) | |||
10.16
|
Omnibus Amendment to Note Purchase Agreements(12) | |||
10.17
|
Voting Agreement dated as of January 17, 2006 among Reliance Steel & Aluminum Co. and each of the stockholders of Earle M. Jorgensen Company named therein(1) | |||
14.01
|
Registrant’s Code of Conduct | |||
21
|
Subsidiaries of Registrant | |||
23
|
Consent of Ernst & Young LLP | |||
24
|
Power of Attorney(13) | |||
31.1
|
Certification of Chief Executive Officer pursuant to Rule 13a-14(a) and Rule 15d-14(a) of the Securities Exchange Act, as amended | |||
31.2
|
Certification of Chief Financial Officer pursuant to Rule 13a-14(a) and Rule 15d-14(a) of the Securities Exchange Act, as amended | |||
32
|
Certification of Chief Executive Officer and Chief Financial Officer Pursuant to 18 U.S.C. 1350, as adopted pursuant to Section 906 of the Sarbanes-Oxley Act of 2002 |
| (1) | Incorporated by reference from Exhibits 2.1, 4.1 and 10.1 to Registrant’s Registration Statement on Form S-4, as amended, originally filed on February 7, 2006 as Commission File No. 333-13625. | |
| (2) | Incorporated by reference from Exhibits 3.01, 3.02, 10.01, 10.02, 10.03 and 10.06, respectively, to Registrant’s Registration Statement on Form S-1, as amended, originally filed on May 25, 1994 as Commission File No. 33-79318. | |
| (3) | Incorporated by reference from Appendix A and Appendix B to Registrant’s Proxy Statement for Annual Meeting of Shareholders held May 20, 1998. | |
| (4) | Incorporated by reference from Exhibit 10.06 to Registrant’s Form 10-K, for the year ended December 31, 1996. |
78
Table of Contents
| (5) | Incorporated by reference from Exhibit 10.10 to Registrant’s Form 10-Q, for the quarter ended September 30, 2001. | |
| (6) | Incorporated by reference from Exhibit 10.11 to Registrant’s Form 10-K, for the year ended December 31, 2002. | |
| (7) | Incorporated by reference from Exhibit 10.1 to Registrant’s Form 8-K, filed on February 20, 2003. | |
| (8) | Incorporated by reference from Exhibit 2.2 to Registrant’s Form 8-K, filed on July 15, 2003. | |
| (9) | Incorporated by reference from Exhibit 10.1 to Registrant’s Form 8-K, filed on December 16, 2004. | |
| (10) | Incorporated by reference from Appendix A and Appendix B to Registrant’s Proxy Statement for Annual Meeting of Shareholders held May 19, 2004. | |
| (11) | Incorporated by reference from Appendix A to Registrant’s Proxy Statement for Annual Meeting of Shareholders held May 18, 2005. | |
| (12) | Incorporated by reference from Exhibit 10.1 and 10.2 to Registrant’s Form 8-K, dated June 13, 2005. | |
| (13) | Set forth on page 77 of this report. |
79